[mashshare]
In this second installment of a case study I am performing on a collegiate men’s basketball player along with Mark McLaughin (“A Case Study on Readiness, Recovery, and Skill Performance in College Basketball”), I share new findings and unexpected discoveries with our primary athlete. During the summer months, some of the initial findings on perceived recovery, objective readiness, and actual skill performance surprised me. It is by no means a final verdict for all athletes, but it points to a growing issue: Are we asking the right questions when we look at performance?
When an Athlete Becomes Advanced and What to Do
Various periods of the year demand a different balance of physical training and sport-specific skill work. As an athlete matures and progresses to higher levels of sport, skill work takes a more prominent role year-round and you can use it as a means of specific training itself. The temporal-spatial awareness needed at high levels of sport is not a switch that you can magically turn on when the season starts.
At the same time, the tissue, movement, and physiological qualities needed to perform that skill cannot be ignored for large periods of time. This is especially true as high physical demands of a specific sport require these elements to function at high levels in specific ways. Part of our long-term focus is better understanding of the balance of training and skill work, and how one may positively—or negatively—affect the other.
Key Point No. 1: We’re asking a specific question about the relationship between readiness, perceived recovery, and actual sport performance.
If the analysis and line of questioning do not directly connect to the performance of the sport, then aren’t we just spinning our data-collection wheels? Listen, there is absolutely a need to better understand improvements in physical performance and recovery, as well as incidence and mechanism of injury. At some point, we must actually ask questions about how these affect the actual game performance of the player and the team. As Fergus Connolly of the University of Michigan tactfully illustrated recently, the most pressing question when using technology or asking questions in an investigation is: “How is this going to help us actually win games?”
Key Point No. 2: The strength and conditioning program wasn’t the primary focus.
We know that Mark has done a tremendous job with our athlete’s physical preparedness in strength and conditioning for basketball. This athlete has elite performance parameters (42” vertical jump, 10’6” broad jump, 1.43 10-yard sprint electric, RHR 45 bpm), and experienced precious few injuries throughout his entire athletic career (none of which happened during the period Mark has trained him).
Key Point No. 3: There is a long-term plan with eyes on in-season competition.
Data hoarding just isn’t polite. If you ask people for their time and participation, you must offer something tangible to reward their efforts. In the initial weeks and months of the project, I began to see ways that we could start to ask less of the athlete and still gather valuable information as we progressed closer to the season.
In season, we will minimize what the athlete will have to input. This is still the goal: maximize the efficiency of our process by minimizing excessive fluff. We don’t need seven or eight data sources for recovery, another five for training, and several more for the sport. We need to be elite with one first, and add more only if needed.
Gather data from sources that are athlete-specific, without being athlete-draining, says @MdHCSCS. Share on XWe use the Omegawave and my Voyager athlete management system, and periodically use heart rate monitors. In-season, we will gather objective information from other sources. It is still athletic-specific, but not athlete-draining.
The Key Factors That Drive Success and Failure
I was determined to start off the project with no expectations about relationships we may, or may not, find with the metrics we elected to track. I absolutely had hunches about particular elements like sleep quality and central nervous system assessments, but I put them aside for the sake of objectivity. While we had a theoretical construct on which to base our line of investigation, we decided it was in the best interest of the athlete and the project to dive in unbiased. We would test this element early and continuously based on our findings.
Consistency is the name of the game. Our athlete was quite steady in his perceived recovery wellness scores. Averaging a score of 20.1 (out of 25) with a standard deviation of less than one for each metric meant that he was, on average, scoring at least a four on all of his wellness and recovery indicators.
This is a double-edged sword: On one hand, working with a diligent and brutally honest athlete is easy. He does what we tell him to, and the results account for this. On the other hand, he sets a high standard that not every athlete I have worked with over the past 13+ years can meet. We have all worked with difficult clients and athletes and guess what? Their progress is more in our hands than we would like to admit. As it turned out, our athlete’s consistency would influence our findings in unexpected ways.
The data-jury was still out, but an interesting picture began to form. We began to see a strong association between “Energy” from our perceived recovery questionnaire and “Fatigue” from the Omegawave reading (r=0.73). Additionally, we saw a perfect one-to-one relationship between the variance of “Fatigue” from Omegawave and the “Focus” metric from our recovery survey. Surprisingly, sleep quality and quantity only had a small association with those two factors. This did not mean sleep was not important, but rather, it showed the importance of practicing caution and not running away with early data findings.
The path to comparing readiness and recovery to sport-specific skill has formed. We needed to compile a more robust database before looking at sport-specific skill outcomes. There were only a handful of skill sessions available, so attempting any type of analysis would be shortsighted. Our athlete kept track of free throw and three-point attempts and makes. I compiled session shooting percentages during the analysis. Additionally, we compiled a simple, subjective training load from the sessions.
Summer Is Not Time Off—It’s the Period of Growth
Summer is a period of more intensive training for collegiate basketball players, with a combination of organized team strength and conditioning sessions and informal, reoccurring open-gym games. Our athlete did a tremendous job of balancing basketball, strength and conditioning sessions, and summer school, as well as a part-time summer internship.
The preseason camp for basketball that occurs in the fall months is an intensive period of basketball-specific activities. Mark’s approach to managing the cumulative impact of all stressors on the athlete was critical during the demanding summer. We will take the same approach during the preseason camp, as the athlete will combine several hours of basketball activities with a full academic schedule.
As we progressed further into the summer months, we started to see shifts in the picture that the data presented on our athlete’s recovery, readiness, and skill performance. The correlation between “Energy” from our perceived recovery questionnaire and “Fatigue” from our Omegawave scan shifted from a large strength of association (r=0.73) to a medium strength of association (r=0.45). We have roughly doubled the sample size over the course of the month, so I believe we are simply seeing a more accurate snapshot of the way these metrics relate.
The correlations between “Soreness” and “Focus” (r=0.68) and between “Soreness” and “Energy” (r=0.79) were two more strong-association relationships. Additionally, “Soreness” and “Energy” (r=0.49) shared a relationship at the very upper limits of a medium strength of association. This begs the question as to how we can positively impact levels of perceived soreness:
- What is the athlete’s nutrition plan, and is he following it?
- Is the athlete’s existing nutrition plan meeting his basic needs?
- Moreover, does the athlete know how to make informed decisions on basic nutritional needs?
- If nutritional needs are being met, what are the limiting factors that impact muscle recovery and soreness?
It should not be a surprise that many of the Omegawave metrics shared medium to strong levels of association with each other. “Sympathetic Activity” and “Level of Tension” showed the greatest positive strength of association (r=0.84) of all the Omegawave metrics. Also unsurprisingly, “Level of Tension” and “Parasympathetic Activity” showed the greatest negative and overall strength of association as well (r=-0.85). The following two images show other highlights of Omegawave metric associations.
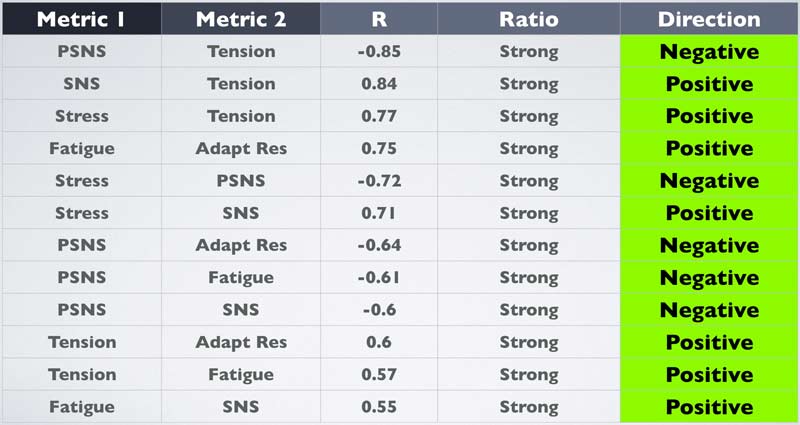

In regard to the relationship between Omegawave readiness metrics and skill performance and work outcomes, a handful of useful insights began to appear.
“Aerobic Status Index” showed the strongest association of all metrics with “session RPE” (r=0.77). As an Omegawave user, the mindset I take regarding this association is to look at the way the aerobic system of the athlete has been developed and managed. The development of specific-oxidative capacities of both slow twitch (type 1-A) and fast twitch fibers (type 2-A) is a critical factor for an aerobic, alactic sport such as basketball. While the current strength of these two associations is not written in stone, I would not be surprised to see their relationship continue.
From a basketball skill standpoint, the “Metabolic Reaction Index” (r=0.65) and “Omegawave Resting Potential” (r=0.58) showed the strongest association with three-point shooting percentage. I find it interesting that there is both a physiological-metabolic metric and a brain-nervous system metric showing a strong association with shooting percentage. “Omegawave Resting Potential” also showed a medium-strength level of association with “Free Throw Percentage” (r=0.37).
Decoding the Strain and Recovery of the Central Nervous System
We continued to employ the F-Test procedure during the summer months to look at how the variances of the metrics compared to each other. Remember, this simply allows us to see if metrics bounce around in similar ways, given a certain threshold we set. This does not infer that the variables are related, nor does it define an applied significance between variables.
We initially look to see if the ratio of variances of two metrics is close to a one-to-one ratio. From there, we either reject the idea that there is no “statistically significant” difference between the two variances (i.e., we define that the variances are not equal), or we fail to reject the hypothesis that there is no difference between the variances (i.e., we can’t prove that there is no difference).
The semantics of null-hypothesis testing are a bit tricky, because when we use this process we cannot outright say that we accept or have proven that the hypothesis of the variances being equal is true. If specific criteria are met, all we can say is that we fail to reject the idea that the variances are different. Transparent, yet lacking definitive clarity at the same time!
As summer progressed and our database continued to expand, we saw more circumstances where we couldn’t statistically prove that there was no difference between the variances of two metrics. In fact, we failed to reject the notion that there was no statistically significant difference between the two variables in nearly half of the metrics we compared the variances for. This by itself is not very impressive, because of the wide range of criteria allowing us to come to this conclusion.
However, it becomes more interesting when we look at the critical values established by this process, and see a ratio of the variances. When seeing ratios close to one, it signifies that the variances of the two metrics being compared bounce around in nearly identical ways. While this does not prove a definitive relationship between two metrics, it does allow the formation of more specific questions surrounding the impact of one metric on another. In regard to our investigation, we are specifically interested in the readiness and recovery metrics that affect actual skill performance.
Once again, objective Omegawave metrics provided some interesting findings when we compared their variances to those of subjective wellness and skill performance. Subjective markers from the daily athlete recovery surveys also provided some interesting insights when compared to skill performance outcomes.
The “total wellness score,” which is a composite of all five recovery scores combined, showed a strong ratio with three-point percentage (1.03), Omegawave Resting Potential (1.09), and Metabolic Reaction Index (1.21). The “Soreness” variance also showed a strong relationship to three-point percentage (1.03), and Omegawave Resting Potential (1.09). Variability in subjective “Focus” scores shared a strong ratio with the variability in the total number of free throws made (1.09), but this alone is clearly dependent upon the total number of free throw attempts and the subsequent shooting percentage.
When writing up assessments and drawing conclusions, don’t forget to look for confounding factors, says @MdHCSCS. Share on XBased on this information, it is interesting to see the relationship of the variances between the total number of free throws attempted and the subjective assessment of perceived “Energy” (1.14). Is it conceivable that the more energetic our athlete felt, the more shots he was willing to attempt and thus increase the total number of free throws made? Perhaps, but this is a great example of not forgetting to look for confounding factors: Maybe our athlete simply had more time to attempt free throws, was less distracted by others in the gym, etc.
There was a very strong ratio between “total sleep time” and “session RPE” (0.97). I felt that we would see more robust findings with sleep metrics, given our theoretical construct for the case study. This raises a great question, as we must confront the idea that there may be factors affecting sleep quality and quantity that govern this process. While our attention goes to sleep quality and quantity, perhaps we should focus attention on the factors that affect these metrics, or the metrics that the sleep parameters affect.
I think it is still possible that sleep metrics, along with other recovery and readiness factors, are indeed a driving force affecting skill performance. However, I think we must decide if sleep is a primary, direct factor or a secondary, indirect factor affecting performance. In all likelihood, there is probably a spectrum along the time continuum where both these instances are true at different times.
During the first stage of our investigation, there was a perfect one-to-one ratio of the variances of “Focus” from the recovery survey and “Fatigue” from the Omegawave. After two months of data collection, this ratio still passes the significance threshold, but has fallen to 0.30. Since we now have a bit more robust and still expanding data-set, I have more confidence that we are now seeing more realistic outcomes. As noted in Part 1, the initial findings are interesting, but there is little point in waving a flag for significance after a month of findings. The pronounced change in the ratio between variances of “Focus” and “Fatigue” exemplifies that well.

Identification of the metrics with variances that stood out when compared to actual skill performance highlighted few relationships. Our skill performance indicators were free throw and three-point shooting percentages. Overall, individual subjective measures by themselves were not quite as robust as the total wellness score when compared to a shooting percentage variance.
“There is no silver bullet predictor in the subjective, self-reported areas when it comes to skill performance.”
My takeaway is that this highlights the importance of an athlete mastering his or her life and activities during the other 22 hours of their day. Sleep, nutrition, stress management, psycho-social factors, or cultural/athletic ecosystems alone will not predict or relate to skill outcomes. There is no silver bullet predictor in the subjective, self-reported areas when it comes to skill performance. The information that the total wellness score has as strong of a relationship with the variability of skill performance and physical work output as any subjective indicator alone leads me to think that the sum of all actions is greater than the whole of their individual parts.
How Coordination Breaks Down and Rebounds
It was particularly interesting to us to see how objective metrics from our Omegawave assessment would compare to skill outcomes. Omegawave Resting Potential (r=0.58) and Metabolic Reaction Index (r=0.65) both possessed strong levels of association with three-point percentage. Omegawave views resting potential as the level of cumulative activity of all functional systems within the body.
It sounds like a hefty statement to process, but think of it this way: The functional systems within our body must coordinate efforts to get things done in an efficient way for survival. Our brain and nervous system need to be able to send information to muscles to move in certain ways, to our heart to beat faster or slower, to our endocrine system to repair muscles or activate fuels, and to our cellular environment to select optimal energy systems for activity.
The many anatomical and physiological systems in our body must work in concert. Omegawave views the resting potential as a window into understanding how in-tune our internal orchestra is for varying parameters of performance. Resting potential is a governing factor of human functionality.
Metabolic Reaction Index (MRI) is a reflection of the energy supply system within our body—one of the systems within our body’s orchestra under the umbrella of the functional system as assessed by the Omegawave Resting Potential. When evaluating the MRI, we get insight into how well our bioenergetics systems are functioning to produce energy. The QRS wave that occurs during the Omegawave ECG assessment evaluates both the aerobic and anaerobic systems and their cooperative capabilities; the MRI defines their overall ability to support physical activity.
Resting potential is a governing factor of human functionality, says @MdHCSCS. Share on XRegarding the three-point shooting percentage, what interests me is that a large governing factor such as Omegawave Resting Potential, and an important bioenergetic marker such as the MRI, have so far shown strong associations to the execution of a sport-specific skill. Conceptually, it’s not difficult to imagine that a fine motor skill such as shooting a basketball from over 20 feet away from the hoop might depend on multiple systems within the body to perform well and coordinate tasks with one another. Given the aerobic-alactic nature of basketball, it’s not surprising that a factor such as MRI may play a role in executing fine motor skills over a duration of time rather than a single instance.
This brings up an important topic regarding this case study, future investigations, and the research process itself. Standardized testing and data collection procedures are a staple of data reliability. During the exploratory phase of this investigation, we elected to cast a generalized net to see if the questions we asked were capable of being answered given our methods.
This required a long-term vision where we defined our outcome and worked backwards and, in this case, we would assess actual game performance as the long-term outcome. Shouldn’t we standardize our shooting percentage assessment for both three-point and free throws? How can we have any confidence in our analysis if there is no set procedure for sport-specific skill performance?
The most important part about this case study is that we have standardized procedures for assessing our independent variables. The athlete performs the subjective recovery and wellness survey, and follows it with the Omegawave assessment. Within 15 to 30 minutes after each skill session, we collect information on shooting performance, session time, and session RPE. This is a standardized process, with the dependent variables assessed accordingly.
The actual procedure for performing sport-specific skills is conceptually designed in a similar fashion to the way that skills are displayed during competition: at random. We have no way to tell a player within a game they must shoot 20 free throws, attempt no less than 25 wide-open three-pointers from the same location on the court, and achieve at least a nine out of 10 effort for a fixed number of minutes.
During the summer months, we kept in mind that the dependent variables we assess in-season from each game will differ from the variables we have available during the early portions of this investigation. For the time being, we established a minimum standard for the number of free throw attempts our athlete makes. Before warming up and at the very end of the session, our athlete performs 20 free throws, making his minimum free throw tally 40.
He will shoot additional free throws between drills within the session—we elected to do this to increase the sample size of free throws taken. As a side note, his free throw percentage has improved slightly over the summer to just shy of 87%. However, his goal is more than 92%.
Mood and Skill Performance: Omega Potential to the Rescue?
While our investigation shifts gears to accommodate preseason preparation with his team, we are focused on understanding what the primary readiness and recovery factors are for this athlete. This athlete’s sleep quality and quantity were not driving factors behind his skill performance, but that does not mean we will allow him to stray from those behaviors. I believe we did not see a more robust data connection between sleep and performance because this athlete got a high quality and quantity of sleep on a consistent basis. In other words, there was no opportunity for big variances in sleep behaviors to negatively impact the athlete’s performance.
This specific athlete will benefit from a more diligent, consistent effort to keep his body fueled with high-quality foods and hydration. In addition, because of a few signs that his skill performance moderately affects his mood and energy, we will most likely implement elements from sport psychology. This includes gearing some efforts towards helping him utilize imagery of positive performance and self-compassion; he is a full-time upperclassman at a private college with more rigorous academic loads and a strong social life, as well as a full-time athlete. He needs to know not everything is always optimal with life demands like that!
I have a strong interest in a deeper dive to look at the Omegawave Resting Potential, mostly because of my own curiosity and passion for understanding how the body performs and responds. I don’t believe it’s a silver bullet to predict human performance, but given the nearly 20 years Mark has used this information when training thousands of athletes, special forces, corporate executives, and fitness enthusiasts alike, we cannot simply ignore the results.
This flies in the face of our data-crazed industry, where data and technology promise so much. To be fair, there is a lack of proof in application. We hear about preventing injuries and predicting performance, yet there have been a consistent number of ligament injuries in the NFL preseason since 2013.
Additionally, there are college and professional teams loaded with data and tech that struggle to do the most important thing: win games. Simultaneously, we have top programs in professional and collegiate sports that win games and titles, but have little to no data and technology. Does this mean sport and performance science is a wash?
#Data and technology aren’t the issue; refining the questions we ask as sports practitioners is, says @MdHCSCS. Share on XThis reminds me of the exposure of the Great and Powerful Oz behind the curtain; pay no attention here! Clearly, I am not against technology and data, and the promise that both might offer. While continuing this case study, it’s explicitly apparent that the technology and data is next to useless without a staff that is wholeheartedly invested in finding a better way to prepare athletes. I don’t think data and technology are the issue: I think we need to refine the questions that we ask as coaches, scientists, and practitioners.
- How do we define success as a team?
- What does it take for us to win?
- What offensive or defensive traits affect our chances of winning?
- What technical or tactical abilities do our athletes need to thrive in our offensive and defensive systems?
- What are the physical, psychological, morphological, physiological, social, or anthropometric traits needed to achieve these techniques and tactics?
- How ready and prepared is the athlete to exhibit these traits?
In all honesty, when we ask these questions about the actual sport-specific performance of an athlete, there is no way that our eye test or just the basics can answer them all. However, sports practitioners often overlook and neglect the basics, leading to poorly planned training, insufficient nutrition and hydration, poor wellness habits, and a lack of program tradition, leadership, enforcement, and communication.
The list goes on, and yet we must master the “basics” first. As I travel, speak, consult, and talk shop with countless members of our field, I think the basics are being mastered better and better at willing institutions. When you have an embarrassment of riches with talent, facilities, resources, and tradition, you had better be winning games!
I cannot say the same for organizations or schools that lack a winning tradition or culture, have average facilities and resources, and cannot attract top recruits or athletes. This is where maximizing every ounce of talent and effort from each player becomes mandatory for mere survival, and failing to ask tough questions and identify indicators of success beyond a superficial level means you are leaning on luck to try and advance your team.
The next steps in our process are both exciting and intriguing, as we enter the start of the athlete’s pre-competition season. Collectively, we are also working to take our assessment model and apply it to athletes within the NBA’s D-League. We have the same means and model, but the added benefit of targeting another high-level athlete going up against top competition. Since our model centers around assessing the actual performance of the sport and working outward, I see a great opportunity to expand to football, soccer, and beyond.
As always, I’d like to extend a special thanks to Christopher Glaeser and his SimpliFaster team, Mark McLaughlin of Omegawave North America, Erik Jernstrom of EForce Sport, and our group of athletes.
Since you’re here…
…we have a small favor to ask. More people are reading SimpliFaster than ever, and each week we bring you compelling content from coaches, sport scientists, and physiotherapists who are devoted to building better athletes. Please take a moment to share the articles on social media, engage the authors with questions and comments below, and link to articles when appropriate if you have a blog or participate on forums of related topics. — SF
[mashshare]


