How I Used Four Assessments to Maximize My Cycling Performance


Summary
Four very different types of assessment proved beneficial as the author trained to complete the 206-mile Seattle to Portland bike ride 20 years after his first successful effort. One key was the near-infrared-based Moxy Monitor. Other vital elements included Omegawave measurements, the Polar heart-rate monitor, and the subjective rate of perceived effort. Proper bike fitting,…
Twenty years ago I did my first Seattle to Portland (STP) bike ride in one day. The event typically attracts 10,000 participants and covers a distance of 206 miles. Four of us finished in approximately 11 and a half hours. I felt a lot of pride by putting in my share of the workload. I didn’t just sit and draft behind the others.
After completing that ride, I took a long break from cycling to begin raising a family and start my own training facility in the Portland, Oregon area, Performance Training Center. About eight years ago I resumed endurance training: cross country skiing, running, hiking, and cycling. A big reason for getting back was my desire to train this type of athlete. What better way to learn than by using myself as a test subject? This led me to research how the top athletes in those disciplines trained and learn about the science driving how coaches planned long-term and short-term goals.
I discovered the first major point on training volume and intensity by studying the world’s best XC skiers. About 80% of their annual training volume (800+ hours) is at an intensity between 120-140 bpm, with higher intensity training making up the other 20%. This made perfect sense to me, as accumulating both high volume and higher intensity would have a negative impact on performance. With this new strategy in place, I set a personal long-term goal for the next four years: year 1 – 500 hours, year 2 – 550 hours, year 3 – 600 hours, and year 4 – 650 hours.
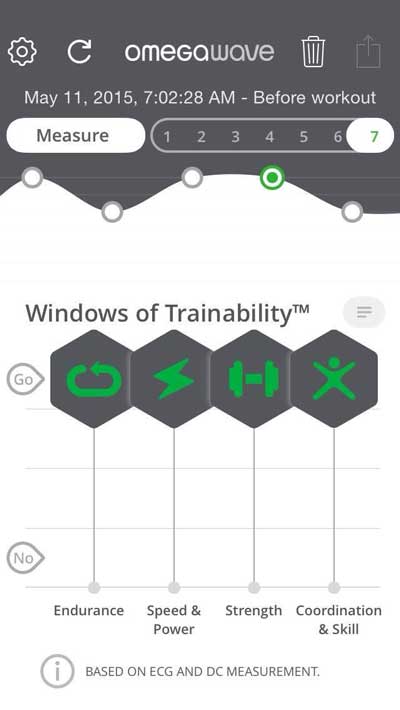
Initially, I used three different assessments to determine my progress. The first was daily measurement using the Omegawave system. Second was the Polar RSX-800 heart rate monitor with GPS, which enabled me to track speed, distance covered, average HR, and maximum HR over a variety of routes. The third measurement, which was subjective, was the rate of perceived exertion (RPE) during training, on a scale of 1-7 (1 being the easiest). During this period I had considerable success with a few key biomarkers: my resting heart rate dropped from 65 bpm to 45-50, my HRV scores improved, and so did my speed at anaerobic threshold in cycling, running, and XC skiing. I did all my training alone, with improving my biomarkers as my internal motivation. I did not compete in any races.
After the first four years, I repeated the same yearly volume as part of my education. At the beginning of this year, I got the itch to compete again to gauge my progress. I called one of the friends with whom I had ridden my first STP to ask if I could join his group. When he said “sure,” I knew I needed to have my training dialed in. I dropped running and XC skiing and focused just on cycling. In early March, I was introduced to a new (to me) product that changed the way I looked at assessing my training and caused me to move forward in an entirely new dimension.
Moxy Monitor
This product—which became my fourth method of assessment—is the Moxy Monitor. As the company’s website says, “Moxy provides real-time physiologic feedback. . . . It uses light from the near-infrared wavelength spectrum (light from about 670 to 810 nm) to measure oxygenation levels in muscle tissue. Human tissue has a low optical absorbance of near-infrared light, so the light can travel to reasonable depths in the muscle. The near-infrared wavelength range is particularly useful because hemoglobin and myoglobin change color in that range depending on whether or not they are carrying oxygen.”
When a colleague introduced me to Moxy, I wanted to learn more about how it could assist my training. Fortunately, the staff at Herriott Sports Performance, a bike shop in Seattle, had been using this technology for the past four years. I called co-owner David Richter to set up my first Moxy test, which consisted of riding my bike on a trainer. I had a Moxy unit attached to each quad. They relayed signals to a TV screen showing my live muscle oxygen saturation (Sm02) and hemoglobin levels. David also monitored my power output and heart rate. This assessment involved a series of steps that followed a pattern of four minutes of riding, followed by a one-minute break. After four or five steps, David identified the heart rate training and wattage zones on which my training protocols would be based. Here is the report he gave me:
You were limited by recruitment. If a muscle can’t utilize O2 any longer, the brain shuts down recruitment. You had available O2, but couldn’t use it. How do you use it? There’s a thing called the Dissociation Curve. It controls your bioavailability of O2. A rightward shift causes a decreased affinity for O2. This makes it difficult for hemoglobin to bind to O2. But it makes it easier for hemoglobin to release O2 bound to it. A leftward shift in the curve causes an increased affinity for O2. . . hemoglobin binds with O2 more easily. But it unloads more reluctantly. You need to move the curve to the right (to release O2). . . only when you’re near maximum effort. Then back to the left (to pick up O2).
Can you see the catch-22? It’s a shell game. It’s a game that is tough to control. It’s a game that is played by your brain, whether you like it, or not. But there are some things that you can do to take control of that curve temporarily. Breathing coordination is how you accomplish that. . . you can temporarily take charge of that curve by regulating CO2. An increase in CO2 results in a decrease in blood pH. But that’s where you play with fire. If you can’t get rid of that CO2, then you have a different problem.
Better breathing coordination will make you better. . . and help with recruitment.
Something else to be aware of, concerning breathing improvement, is that cyclists expend a lot of energy stabilizing their trunk to optimize power production. Breathing and core stabilization are in competition. Breathing costs. . . so, demand for breathing by increasing breath volume is more efficient than increasing the frequency. Breath training will be very useful for you. A great place to start is a POWERbreathe. I started with that in 1996 and have been using it since. Great tool. We should have them back in the Pro Shop this week.
Here are your zones:
- Active Recovery (AR) 0-119bpm/0-189watts
- Structural Endurance Intensity (STEI) 120-149bpm/190-259wattsFunctional Endurance Intensity (FEI) 150-175bpm/260-330watts
- High Intensity (HI) 176+bpm/340+watts
This assessment made me think about assessments, training, and the many other factors involved in planning training, intensity, volume, and recovery. I was very excited to get to work using my new training zones. I also scheduled another Moxy assessment for five weeks out to see how I was improving.
Bike Fit
During this first test David noticed that my bike position did not look right, so we scheduled a bike fit prior to my next appointment. David has been doing bike fitting for eight years and has worked with some of the world’s top professionals. The objective is putting you in the best possible position to work efficiently through a series of measurements, including saddle height, cleat position on the pedal, seat fore/aft position, reach to handlebars, width of handlebars, and stem height. David used lasers after each tweak was completed to make sure I was tracking in the proper line. Three things jumped out as areas with the biggest potential for performance improvement: saddle height (we raised it 1.5”), cleat position, and handlebar width and stem length.
Making Progress
During the next five weeks, I trained on average 14 hours per week, with 80% of the volume in the STEI zone (structural endurance intensity), 10% in the FEI zone (functional endurance intensity), and the balance in AR (active recovery). Here are the results David sent me of my second Moxy assessment after five weeks of training and my new bike setup:
- AR – 0-120bpm/0-220watts
- STEI – 121-140bpm/221-275watts
- FEI – 141-168bpm/280-350watts
- HI – 169+bpm/360+watts
The POWERbreathe training will change your game. . . but not as much as your new position did! I look forward to seeing you in a few more weeks, to see more progress.
Armed with my new zones and bike position, it was time to get back to work. I had another assessment scheduled for five weeks out. I kept the same percentages of work I had used in the previous training block in each training zone. I also kept volume per week at the same level. At this time, I was only using heart rate to keep me in my training zones as I did not have a power meter. I planned to purchase one on my next visit.
I returned to Seattle on May 8 for my final test before STP. I was feeling good about the training I had done over the past five weeks and felt like the improvements on this test would be very good. Here are the results Dave sent me from test #3:
- AR – 0-124bpm/0-225watts
- STEI – 125-152bpm/226-280watts
- FEI – 153-170bpm/280-350watts
- HI – 171+bpm/365+watts
A trend that I have identified is something we slightly touched on, a L/R difference. Your right leg is working harder (especially at lower workloads). My guess is that it’s more than a strength issue, a coordination issue, as well. So, I’d recommend some isolated leg strength training off the bike. . . or PowerCranks. Simple functional movements are all you need. . . single-legged exercises to help with the coordination. Pedaling millions of times helps, too!
Good job with the breathing, biggest improvements there. . . your smO2 dropped the lowest to date and tHb higher throughout this evaluation. . . built capillaries. . . a better delivery system. Keep cranking and talk with you soon.
These would be my training zones leading up to STP on July 11. For the next three weeks, I would work in the same % for the zones: 80% in the STEI, 10% in FEI, and 10% in AR.
#BloodDontLie
I have had blood work before, but it was always to test basic cholesterol, blood glucose, white blood cell, and so forthbasic health markers vs. anything performance-oriented. I spoke with Carl Valle, the head of innovation at InsideTracker, about getting myself tested and begin a N=1 experiment on my-self. Here is what InsideTracker is looking at, according to their website:
InsideTracker is a personalized health analytics company founded by leading scientists, physicians, nutritionists and exercise physiologists from MIT, Harvard and Tufts University. The InsideTracker platform tracks and analyzes key biochemical and physiological markers and applies sophisticated algorithms and large scientific databases to determine personalized optimal zones for each marker. InsideTracker’s expert system offers science-driven nutrition and lifestyle interventions that empower people to optimize their markers. When optimized, these marker levels have been scientifically proven to increase vitality, improve performance and extend life.
Our goal is to empower individuals with the essential information they need to manage and optimize their health. We believe that by providing a dynamic, personalized analytic platform at the intersection of biology, science and technology, then distilling the results into simple, natural, and sustainable nutrition and lifestyle recommendations to follow, we can help people live longer, healthier lives.
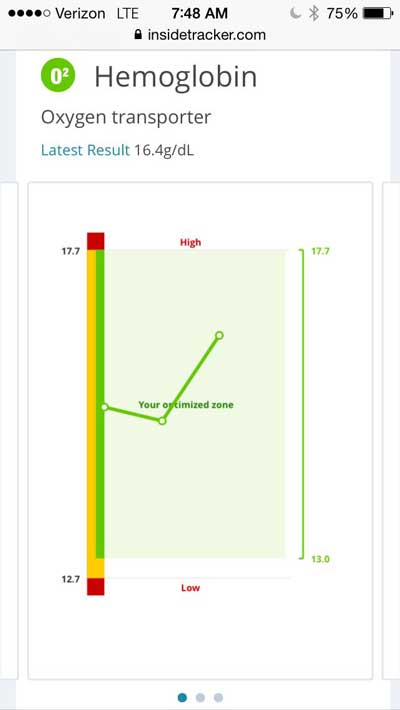
The beauty of the InsideTracker assessment is that it provides food, lifestyle, and training suggestions to assist you in bringing these elements into an optimal zone for you. The personalization is world-class. I signed up for the Ultimate panel, which looks at 30 biomarkers in addition to providing a bonus “inner age” score. I had the results quickly. The two markers needing immediate work were blood glucose and testosterone/free testosterone and their relationship with cortisol. Since this was a base-line test, I would continue to train as I had been.
Following the blood test, I began a concentrated loading phase in which I would perform seven training sessions in a four-week period in the FEI level at an HR of 152-171 bpm. I would perform an FEI session on Monday based on my readiness level according to my daily Omegawave assessment. These sessions consisted of 20-60 minutes of intervals (10-20 minutes of work followed by 5-10 minutes of easy riding). Then for the next 1-3 days I would do training sessions in the AR. When my Omegawave readiness was back to my baseline level, I would go out for another hard interval session. On some days, my muscles would be sore when I would go hard during the intervals, even though my readiness scores for my cardiac and central nervous systems were optimal . When this occurred, I would go home and not try to push it.
During this block, I used two performance markers to gauge my progress. The first was a 20-minute interval, in which I tracked distance, speed, and power output. The other was a hill climb. My 20-minute interval improved from 6.6 miles, 18.7 mph, and 287 watts to 7.7 miles, 21.7 mph, and 326 watts. My hill climb dropped from 10:06 to 8:59.
Sleep Monitoring
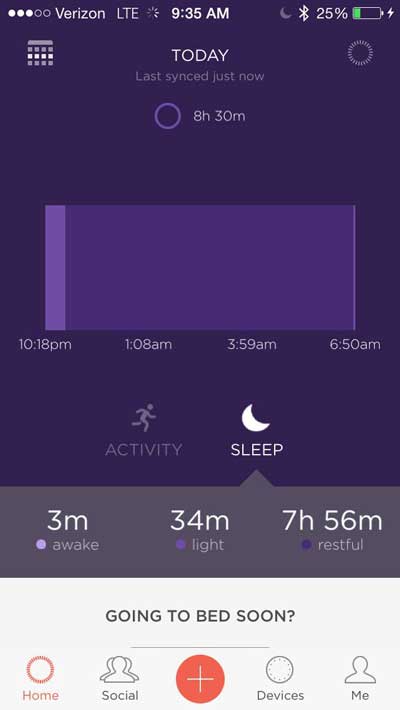
After my initial blood test through InsideTracker, Carl and I discussed sleep quality and monitoring because poor sleep can lead to lower testosterone levels. Following up on Carl’s suggestion, I purchased the Misfit Flash, a movement and sleep tracker. The first 30-45 days were strictly to begin collecting data and implement a few simple ideas to promote better sleep quality.
First, I turned off my phone, laptop, and iPad two hours prior to going to bed. Then I began sleeping with a blackout mask to keep out as much light as possible. It is very interesting to see how you truly sleep, if you are getting a good 7-9 hours, and how much restful sleep you get vs. being restless and waking a lot during the night.
Race Day Arrives
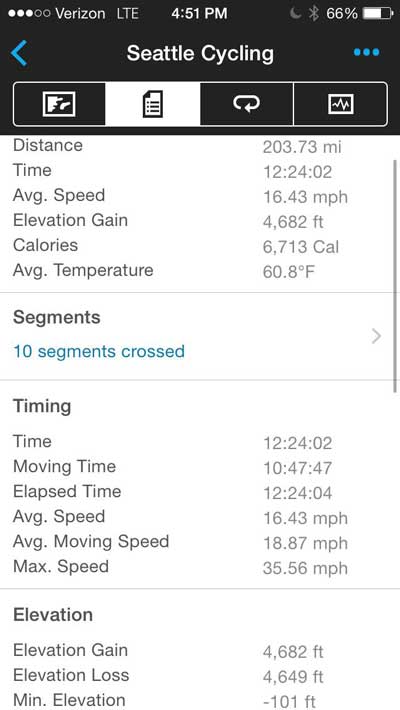
For several weeks before the race, average temperatures ranged between 85-95 degrees F, which in Oregon and Washington state is out of the ordinary. So wouldn’t you know it—on race day it decides to be overcast with a strong chance of rain! I rolled out as part of a group of eight riders at 4:45 AM. During the first part of the ride, everyone wants to go super-fast. As a veteran, I needed to remind the newbies that we had a long day ahead of us and that they should keep calm and not burn too much energy too soon. Twelve hours and change later I finished. Average moving speed was 18.9 mph. My energy throughout the ride was very good, and I handled the changes in tempo fairly well even though I had not ridden at those speeds for any distance over 100 miles in a long time.
As you can see, this was a very long-term progression that ended successfully with a respectable time. In terms of assessment and monitoring these days, the options seem to be endless. The key is being able to understand what you are tracking, getting a clear picture of what the data means, and recognizing how it equates to improved performance. This process takes time and having patience becomes a key component of long-term success.
I would like to thank a few people. First and foremost is my wife, Deb McLaughlin. Without her full support, love, encouragement, and putting up with my endless research, none of this would have been possible. To Carl Valle, for showing me another way to think about monitoring and how to take it a step further in how we relate it to improved performance. To Coach “Rio,” for introducing me to the Moxy Monitor, his keen insight regarding performance enhancement as it deals with endurance sports, and his expertise in assisting in my training. Finally to my editor Peter Ingleton, who made me an offer a few years back to assist me in my writing endeavors. I am extremely happy I took him up on that offer. He makes me sound like I know what I am writing about.
