Using Pre-Season Testing to Support Decisions That Matter


Summary
With any performance test, there’s a lot of very helpful information to unpack once the athlete completes the test. Coach Pata moves past the testing protocol and dissects how to use the information to build a player comparison tool that helps evaluate players, game strategy, and program quality.
If you’re like me, August is the most exciting month of the entire year. Football, soccer, volleyball, and cross country athletes are returning to campus for the pre-season camp. There’s always the mix of freshmen who are overwhelmed and walking around wide-eyed. The seniors, grizzled with their years of experience, are anxiously waiting to begin the countdown of their precious few remaining competitions. As all of these athletes come back to campus with their range of goals and hopes and dreams, their sport and strength coaches immediately have to wrestle with a tough question.
Should You Test Athletes at the Start of Pre-Season?
Believe it or not, this is a much bigger question than you might think. I’ve wrestled with both of sides of the argument and found the heart of the matter lies in a discussion about injuries. Those who oppose testing at the start of pre-season don’t want to see anyone injured in non-sport related activities. It’s a difficult opinion to argue against because I completely agree with it. After all, no one wants to see people get hurt, and it’s especially heart-wrenching to see someone go down before they even get to the first practice.
On the other hand, some coaches believe that if an athlete is going to get hurt in testing, that means they would get hurt within the first few practices anyway. I’m lucky because the head coaches I usually work with fall into the latter mindset, so they want to do some pre-season testing. With that said, let me ask you the big picture question: What’s the point of testing your athletes in the first place? Really, what information are you looking for after putting athletes through your testing battery?
In a previous post, I talked about the best conditioning test I know. With any performance test, there’s a lot of very helpful information to unpack once the athlete completes the test, so let’s move past the testing protocol and dissect what I do with the information.
When we get down to the nuts and bolts of performance testing, we’re conducting a mini experiment with our athletes. Think about it for a second. Both research subjects and our athletes complete a baseline test to see where they are with their skills. Then we expose them to a stimulus—be it a lifting program, supplement or placebo, sprint or agility program, or anything else. At the end of a set time period, the subjects and athletes come back and complete the same tests so we can compare their pre- and post-test results. We do all this work to answer the age-old question coaches and researchers wrestle with: Will doing this make any difference?
Know Your Own Athletes
There’s almost a century of research that gives us a solid foundation for the scientific principle and a baseline for determining appropriate training methods. While I’m certain that the General Adaptation Syndrome from Dr. Hans Selye or the Fitness-Fatigue Model credited to Dr. Mel Siff will fit almost every situation, there’s one glaring omission concerning all training programs—they were not designed using your athletes. It might be trite, but there are so many differences between what I’m able to do with my group of athletes and what another coach can do with their athletes. Is it a fair comparison to look at the results I get and automatically assume another coach will get the same?
There is a lot from the late Charlie Francis’s programs that I like and use, but there’s always an asterisk when looking at his athletes’ results. Many of his former athletes tested positive for performance-enhancing drugs, and we can all agree that these drugs help training a lot. So should I blindly follow the high-low training idea that Charlie Francis publicized? Of course not. He worked with the top sprinters in the world. I do not. Some of his athletes took drugs, none of mine (I hope) do. Surveying his work is a good start, but it can’t end there.
I look at the results from what my groups have done historically, compare those results to changes I’ve made with their programs, and then follow the advice of Bruce Lee: “Absorb what is useful, reject what is useless.” After doing this style of test-analyze-compare for years, I’m very confident that when someone goes through one of our 6- to 8-week long off-season training programs, I can predict their expected outcomes.
| Squat Improvement | Bench Improvement | Vertical Jump Improvement | Acceleration Improvement | Change of Direction Improvement | |
| Freshmen (APRE Style) | 6%-9% | 6%-9% | 3%-5% | 3%-5% | 3%-5% |
| Sophomore (High-Low Style) | 7%-11% | 6%-8% | 4%-6% | 3%-5% | 3%-5% |
| Junior (TriPhasic Style) | 3%-4% | 2%-4% | 5%-7% | 5%-6% | 4%-6% |
| Senior (TriPhasic & Velocity Based Training) | 4%-7% | 3%-5% | 6%-8% | 5%-7% | 4%-6% |
All of this information helps when having an honest conversation with everyone involved in your program. Having records of your past results is the only way to see if you’re helping athletes get better or if you need to try something different. This type of review is very helpful for all of us in the strength and conditioning profession who want to confirm that our mesocycles are working and that we’re getting an appropriate transfer of training.
But what about those people who don’t have our background and education, like sport coaches? Do they care about the incremental changes their athletes are getting, or do they care about how these changes impact the way their athletes can play the game? With team sports, isn’t this the real question we should be trying to answer?
From the Spreadsheet to the Playing Field
Don’t get me wrong, I have a track and field background and have competed in powerlifting, strongman, and weightlifting competitions, but these are different than team sports. With team sports, many factors that can’t be quantified come together to determine a winner. We’ve all seen it before; being the strongest, fastest, or most conditioned team does not necessarily mean you will win. You have a better chance, true, but it doesn’t mean the victory is in the bag. So you might be asking yourself, “Then what can I do to help out sport coaches?” I’m glad you asked.
How to Build a Player Comparison Tool
When it comes time to have hard conversations about keeping or cutting players from a team roster, I’m usually invited to attend the meetings. For years, I made the mistake of using too many terms that only strength coaches understand or charts that were too difficult to understand quickly. Well, that changed. Below is an example of one athletes’ profile and is typical of what I present to the coaches now.
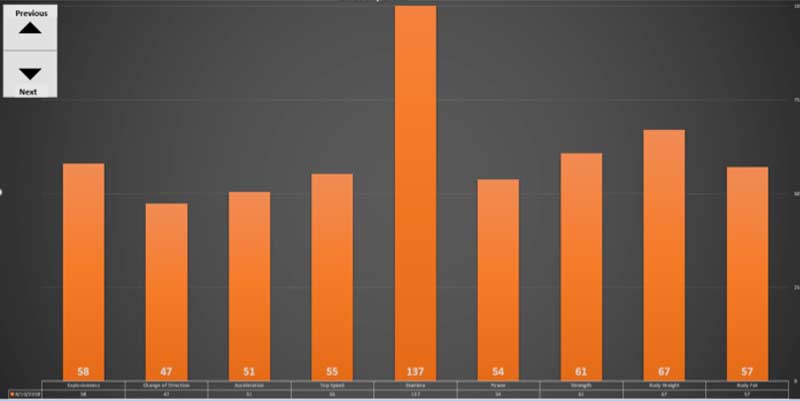
Thanks to the magic of Excel, I have a graph for each player that compares their performance to the average for their position group, which gets created by clicking the up or down arrows. I know there’s a lot of information here to unpack, so let’s take a closer look. Starting from left to right, the athletic qualities and associated measurement methods are:
- explosiveness (vertical jump)
- change of direction (5-10-5 pro agility)
- acceleration (10-yard sprint)
- top speed (10- to 20-yard split)
- stamina (220 fatigue resistance)
- power (power clean pull using GymAware)
- strength (back squat 1-rep max)
- body weight (a calibrated scale)
- body fat (three-site skinfold pinch)
Using some really basic statistical breakdowns, I made this chart which compares our current players to the historical average in their position group. Without going in depth with the equations, here is the basic idea.
- Find the average for your category. It’s the sum of the results divided by the number of attempts.
- Calculate the standard deviation. Excel is very helpful with this since you have to square and take the square root of each attempt subtracted from the average. You should do it longhand once or twice to get to know the equation, but when you’re doing this for more than four data sets, use Excel.
- Now that you have your standard deviation and your average, you can define a range of scores that you would expect 68.2% of people to be within. The low number of the range is your “0” or worst score possible. The high number of the range is your “100” or best score possible.
- Take your 100 score and subtract from it your zero score. This shows the range of acceptable scores for that test.
- The next part is the one tricky point in the whole process. You have to subtract the athlete’s score from the 0 score, then divide it by the range. Finally multiply it by 100. Hang in there, I’ll show you an example in a second.
- Now you have a number that is relative to their performance. Keep in mind that it is not the actual score but how it relates to their If they score a 50 in any category, that’s average, a 100 is very good, and a 0 is not.
Here is the actual data set from this player’s position group.
| Explosiveness (from a vertical jump test) | Average Score | Standard Deviation | 0 Score (you don’t want these players) |
100 Score (you want these players) |
Range |
| 31.4 | 10.6 | 20.8 | 42.0 | 21.2 |
This player ranked 58 in their explosive quality. The equation is (33-31.4)/21.2 then multiply it by 100. This gives you 57.86 which becomes a score of 58 when rounded.
Let me be upfront, there’s a lot to do to set this up, and with Excel you can get a headache in a hurry chasing after an equation. Is it worth the time and energy? It is for me. In a brief instant, everyone can see how players’ skills rate. This player is pretty average for their position except in their stamina, and they’re slightly above average with their strength and body weight. In fact, they scored off the chart on their stamina. Now, I purposely cap the chart at 100 and zero even though I might have players score outside these boundaries, and that’s OK. Since this a comparison of how my current athletes compare to the historical average, I’m fine with having outliers.
In the example, the player has a ridiculously high score in stamina (137), but the chart is capped at 100. What’s important is that the player can do repeated bouts of high effort work and not fatigue as fast as some others in their group. With this in mind, if this athlete were to change positions or even play a different sport, their score would change to reflect the “average” for the new team and position group. Remember, we’re making a relative comparison of athletes in the same position group, not comparing them to a national average.
How to Use the Player Comparison Tool
Now that you’ve built this tool, how can you use it? As I mentioned, I am invited to the coaches meetings to talk about their prospects. By using this player profile, everyone can easily see if this person is athletic enough to keep up with the rest of the team. If I were at a school that offered athletic scholarships, I would push the head coaches to use this information for scholarship offers.
Think of it this way: If two recruits can play the game about equally, who will you offer a scholarship to? Tough one. What if we had their player profiles and one athlete didn’t score above a 50 in any category, and the other didn’t score worse than a 60. Would that information be helpful? It sure would.
The player profile tool helps everyone see if an athlete can keep up with the rest of the team, says @CarmenPata. Share on XIf you’ve been keeping records on athletes for a while, you know who the all-stars or stand out players were. In that case, why don’t you use their information to build your data sets? This way, you’re comparing people to the best athletes you’ve worked with instead of the average from the best and weakest athletes you’ve worked with. Would this give you a better idea of what type of athletes are on a team? Now that I say this, I might want to make this change myself.
If you have sport coaches who are open to having open and honest conversations, this information becomes important in another way. It can help plan game strategy. Knowing each player’s weaknesses and strengths gives some insight on how to best use them to maximize their potential. For example, let’s say you have a star basketball player whose acceleration and change of direction ability rank very high, but their stamina and top speed ability scores are low. I would recommend to the coach that they have subs go in for this athlete often and suggest they change the team’s tempo on offense or defense.
The athlete profile tool helps plan game strategy and assess program quality, says @CarmenPata. Share on XLooking through these charts is also one of the ways I do in-house quality control of our programs. You saw the expected improvement ranges when players go through a 6-8 week off-season phase; looking at these graphs over time is a fast way to check if you’re helping your athletes improve.
It’s likely we’ve all worked with athletes who don’t improve at the expected rate, and all too often we blame the athletes. As coaches, we ask them if they’re recovering, eating right, or staying up too late. Or we blame their outside activities. Don’t get me wrong, there is a lot of truth in these questions, but it might not be completely on the athlete.
All athletes have different training ages, backgrounds, and abilities. Our freshmen workouts are three lifting days a week. What would you expect to see if an athlete comes in with a training background of four or five days a week? I would guess that their volume-load in a three-day program is actually their retaining or detraining load. This means they will either plateau or get worse. It’s not always, or completely, the athlete’s fault.
The Truth Is Out There
The real beauty of testing and building this tool is discovering the truth. The truth about your program. The truth about the players. The truth about realistic expectations. If you’re already testing your athletes regularly, you have this information and may need to spend some time upfront to format all of it. If you don’t test your athletes, this article has given you some points to think about. Either way, reach out when you need help. The truth is out there.
