Working in the NFL gave me an opportunity to delve deeply into the vast array of data in the game of football. I worked with data across the entire business of the sport, including the Salary Cap, game stats and contract analysis, electronic medical records, and player performance information. I learned the importance of capturing and connecting every bit of information because it very likely would become a valuable asset to the organization.
I co-founded RockDaisy AMS to deliver value from data by making complex information easily accessible and understandable—one of our key targets is athletes and their supporting organizations. Athletes produce a wide array of performance, fitness, and effort information. This article discusses a small segment of what can be accomplished by collecting wearable GPS data, layering in conditional formatting to spot outliers, and connecting it with the broader base of data accumulated for every athlete.
Key GPS Metrics
The Global Positioning System (GPS) is a satellite-based navigation system that provides location and time information in all weather conditions. It is important because GPS devices are relied on to track athlete movement and physical activity accurately. GPS data can help coaches and trainers monitor their performance, recovery, and injury risk.1,2
There are five key metrics that all GPS vendors make sure their devices track. These specific metrics are essential because they cover three separate areas of training: volume, intensity, and speed.
-
- Total distance covered: Provides information about the amount of ground covered by the athlete during a training session or game. It helps the coach determine the athlete’s intensity and workload and adjust their training program appropriately.3
-
- High-speed running distance: Measures the distance covered by an athlete at high speeds and provides information about the athlete’s explosive power, acceleration, and deceleration.4
-
- Accels/Decels: Both accelerations and decelerations can contribute significantly to a player’s load and are useful indicators of external load; therefore, their value within athlete monitoring seems to be gaining importance.5
-
- Sprint count: Measures the number of times an athlete exerted an effort that was above a defined speed threshold.
- Maximum velocity: Provides information about the highest speed reached by an athlete during a training session or game and helps to determine their overall speed and agility.1
A coach should be concerned if certain GPS metrics for a training session go above or below a certain threshold, as it can indicate a potential problem with the athlete’s performance or health. The specific thresholds for each GPS metric can vary depending on a number of factors, including the sport, the athlete’s position, and their individual characteristics. For example, a soccer player’s average speed during a game might be expected to be around 5–7 meters per second, while a sprinter’s maximum velocity might be expected to be about 10–12 meters per second.
However, some general guidelines are given below:
-
- Total distance covered: A decrease in total distance covered could indicate fatigue or injury, while an increase could indicate improved endurance.
-
- High-speed running distance: A decrease in the high-speed running distance could indicate a decrease in explosive power or an increased risk of injury, while an increase could indicate improved conditioning and reduced injury risk.
-
- Accels/Decels: A decrease in accels/decels could indicate fatigue or injury, while an increase could indicate improved conditioning and reduced injury risk.
-
- Sprint count: A decrease in sprint count could indicate a decrease in speed and agility, while an increase could indicate improved explosive power.
- Maximum velocity: A decrease in maximum velocity could indicate a decrease in speed and agility, while an increase could indicate improved explosive power.
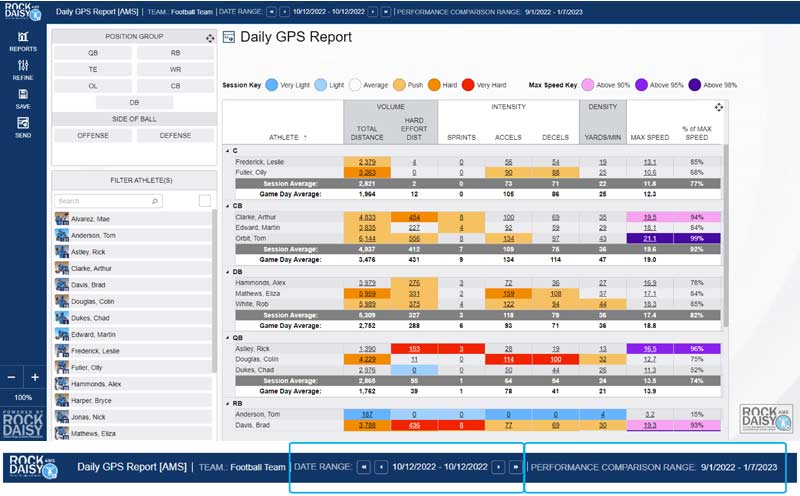
Comparing an athlete’s performance across two different periods is an effective way to see performance trends. For example, the RockDaisy Athlete Management System includes a Performance Comparison Date Range filter. The Performance Comparison Date Range filter can be set with a start and end date (e.g., the beginning and end of a season) to compare against daily data. This filter allows you to compare an athlete’s performance for a particular metric against their average for a season (or a comparison time frame you select).
The Performance Comparison Date Range filter also enables users to set standard deviation thresholds to understand a significant increase or decrease in an athlete’s performance.
This can be seen in the color coding of this Daily GPS Report (dashboard design provided by Benjamin Creamer, @coachbencreamer, Director of Sports Science at University of Washington).

The In-Season Average is key because it drives the functionality of the legend. If an athlete is within a certain standard deviation of their average, their data will be colored on the bucket they fall in. For example, if an athlete goes two standard deviations above their average for the season, that metric for the athlete will have a red background and be considered a “very hard” day.
It is important to note that these are general guidelines, and the specific thresholds for concern will depend on the individual athlete and their sport. Moreover, several other data sources can be useful to overlay with sports GPS data to get a complete picture of an athlete’s performance.6–11
Other suggested metrics that can be overlayed with GPS data:
-
- Heart rate data: By overlaying heart rate data with GPS data, coaches can better understand the athlete’s physiological response to exercise and determine if they are working at the appropriate intensity.
-
- Biomechanical data: By overlaying biomechanical data such as joint angles and muscle activation patterns with GPS data, coaches can better understand the athlete’s movement patterns and identify any areas of movement that may be contributing to injury risk.
-
- Nutrition data: By overlaying nutrition data with GPS data, coaches can better understand the impact of diet on the athlete’s performance and recovery.
-
- Video analysis: By overlaying video analysis with GPS data, coaches can better understand the athlete’s technique and movement patterns and identify areas for improvement.
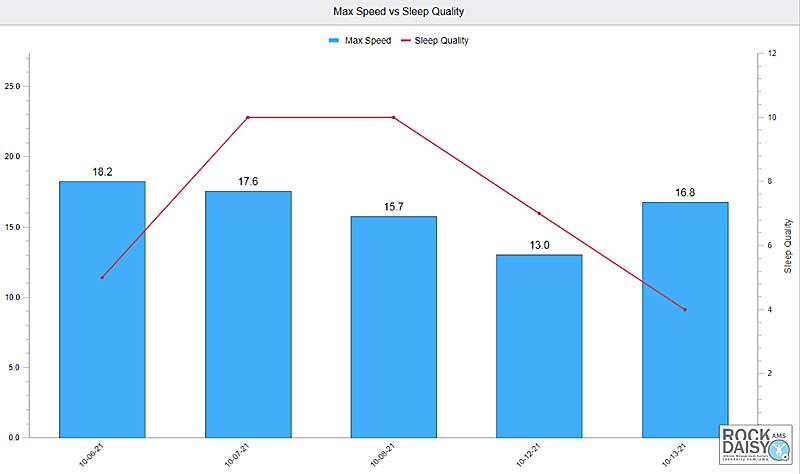
- Sleep data: By overlaying sleep data with GPS data, coaches can better understand the impact of sleep on the athlete’s performance and recovery.

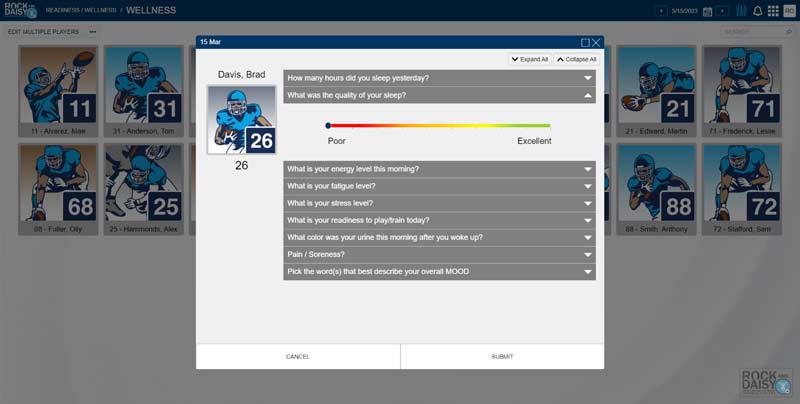
Additional metrics can easily be imported from spreadsheets, from third-party APIs, or by leveraging customizable data collection forms. These metrics can then be easily overlayed with GPS data.

By combining GPS data with other data sources, coaches can understand the athlete’s performance more comprehensively and make more informed decisions about their training and injury prevention strategies.
By combining GPS data with other data sources, coaches can better understand an athlete’s performance and make more informed decisions about their training and injury prevention strategies. Share on XRockDaisy has worked with multiple GPS vendors, and we understand the key performance indicators that are recorded during a training session. Our GPS report pack is a collection of GPS reports that are ready to use and/or can be customized to your needs. With our unique data visualization tools, we provide insight into your data outside of just the raw numbers. Feel free to contact us for more information.
Since you’re here…
…we have a small favor to ask. More people are reading SimpliFaster than ever, and each week we bring you compelling content from coaches, sport scientists, and physiotherapists who are devoted to building better athletes. Please take a moment to share the articles on social media, engage the authors with questions and comments below, and link to articles when appropriate if you have a blog or participate on forums of related topics. — SF
References
1. Cummins C, Orr R, O’Connor H, and West C. “Global positioning systems (GPS) and microtechnology sensors in team sports: a systematic review.” Sports Medicine. 2012;43:1025–1042.
2. Theodoropoulos JS, Bettle J, and Kosy JD. “The use of GPS and inertial devices for player monitoring in team sports: A review of current and future applications” Orthopedic Reviews. 2020;12(1).
3. Aughey RJ. “Applications of GPS technologies to field sports.” International Journal of Sports Physiology and Performance. 2011;6(3):295–310.
4. Rampinini E, Alberti G, Fiorenza M, et al. “Accuracy of GPS devices for measuring high-intensity running in field-based team sports.” International Journal of Sports Medicine. 2015;36(01):49–53.
5. Wing C. “Monitoring Athlete Load: Data Collection Methods and Practical Recommendations.” Strength & Conditioning Journal. 2018;40(4):26–39.
6. Backhouse SH, Whitaker L, Patterson L, Erickson K, and McKenna J. “Social psychology of doping in sport: A mixed studies narrative synthesis.” Prepared for the World Anti-Doping Agency. 2016.
7. Backhouse SH and McKenna J. “Doping in sport: A review of medical practitioners’ knowledge, attitudes and beliefs.” International Journal of Drug Policy. 2011;22(3):198–202.
8. Bădescu D, Zaharie N, Stoian I, Bădescu M., and Stanciu C. “A Narrative Review of the Link between Sport and Technology.” Sustainability. 2022;14(23):16265.
9. Halson SL. “Monitoring training load to understand fatigue in athletes.” Sports Medicine. 2014;44(Suppl 2):139–147.
10. Seshadri DR, Drummond G, Craker J, Rowbottom, JR, and Voos JE. “Wearable devices for sports: new integrated technologies allow coaches, physicians, and trainers to better understand the physical demands of athletes in real time.” IEEE Pulse. 2017;8(1):38–43.
11. Wilkes JR, Walter AE, Chang A-M, et al. “Effects of sleep disturbance on functional and physiological outcomes in collegiate athletes: a scoping review.” Sleep Medicine. 2021;81:8–19.
12. Wisbey B, Montgomery PG, Pyne DB, and Rattray B. “Quantifying movement demands of AFL football using GPS tracking.” Journal of Science and Medicine in Sport. 2010;13(5):531–536.
13. GPS Dashboard image (Figure 1). Dashboard design provided by Benjamin Creamer, Director of Sports Science at University of Washington.


