Strength Continuum in Resistance Training: Answering the ‘Why’

Summary
The Strength Continuum in resistance training is a common means of categorizing the core subsections of strength—which incorporate power, velocity, and force—during the concentric phase of a resistance exercise. In this article, Coach Ty Sevin clarifies basic qualities and protocols within each subsection of strength to help performance coaches improve their implementation of training modalities.
Over the past decade, there has been a growing trend among performance professionals to quantify and define subsections of strength. This practice has often been demonstrated along a strength continuum in the hopes of enhancing the application of resistance training. Differences in language and terminology about how strength is classified often create dogmatic approaches regarding the specific parameters of subsections, subsequently leading us away from application variables. (Pfaff, 2018) This article is an attempt to clarify basic qualities and protocols within each subsection of strength to improve the implementation of training modalities.
Overview of the Strength Continuum
The Strength Continuum in resistance training is a common means of categorizing the core subsections of strength during the concentric phase of a resistance exercise. These core subsections incorporate power, velocity, and force—the qualities that all subsections are based on—and ultimately help us illustrate how adjacent subsections that seem perceptibly similar in nature have independent qualities and are actually quite unique at the extremes. Some popular subsections along the strength continuum that are commonly referenced in available literature are:
- Absolute Strength
- Maximum Strength
- Accelerative Strength
- Strength Speed
- Max Strength
- Basic Power Development
- Speed Strength
- Absolute Speed
- Elastic and Reactive Strength
With so many referenced categories, it becomes vital to have a basic understanding of the characteristics of each subsection and knowledge of the variables associated with them.
Do not confuse the Strength Continuum in resistance training with the Strength-Endurance Continuum in weight training. Share on XThis concept should not be confused with the Strength-Endurance Continuum, which is a weight training concept based on the theory that muscle strength and muscle endurance exist on a continuum with strength represented by the 1RM (the 1-repetition maximum; i.e., the maximum load that can be overcome by a single effort), and muscle endurance represented by the ability to exert a lower force repeatedly over time. (Oxford, n.d.)
For the purpose of this article, I will only reference data that applies to traditional “power lifting” exercises, such as the back squat and bench press. Olympic lifts will be omitted from this discussion because they fall into a group of exercises where the primary purpose is to increase the rate of force development (RFD). (Schexnayder et al, 2014) There are many variables that make the comparison extraneous from both a micro and macro perspective.
Author’s Note: The deceleration phenomenon seen during a concentric contraction of traditional exercises can be attributed in part to the mechanical disadvantages associated with free weights as a form of resistance. Many researchers believe that a movement that allows force and muscle activation to be maintained throughout an entire range of motion can lead to increased athletic performance. Exercises that are performed using pneumatics as resistance have shown, through kinetic and electrographic profiles, to have superior force maintenance and muscle contractions throughout the entire range of motion in comparison to both free weights and ballistic movements. (Frost, 2008)
Force, Velocity, and Power
A force (strength) is simply stated as something that acts on an object by pushing or pulling it, and is commonly denoted in Newtons (N) and represented on the force axis in kilos or pounds.
Velocity (speed) is quantified as the rate at which an object moves in a direction, and is usually expressed in meters per second (m/s), or inches per second (i/s). The coalescence between force and velocity allows us to determine power.
Power is the product of force and velocity, and is defined as the rate at which work is done or the rate at which energy is transferred from one place to another. Power is calculated as the amount of work (force x distance traveled)/time. Power in most applications is denoted in watts (W).
Force-Velocity Curve
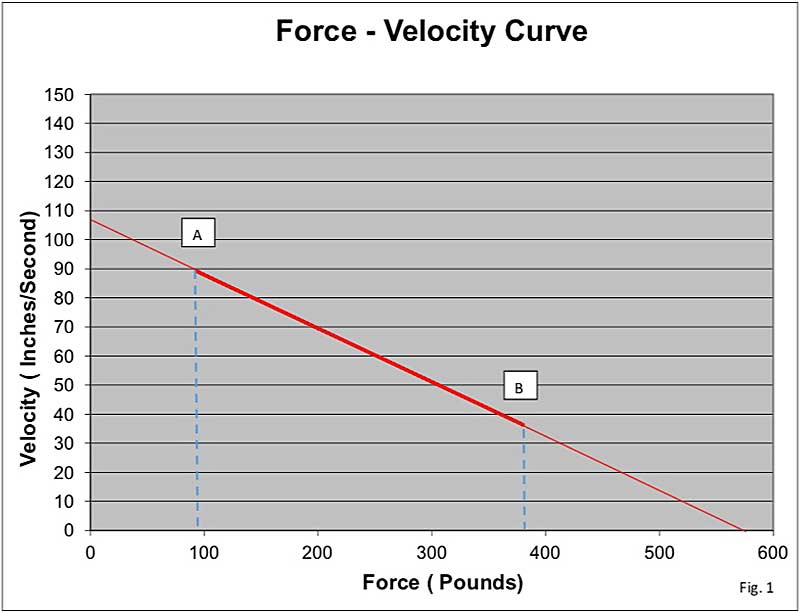
Force and velocity can easily be charted along A.V. Hill’s (1938) force-velocity curve to demonstrate the inverse relationship between force and velocity. The hyperbolic relationship between force and velocity that he described has become the foundation on which subsequent muscle discoveries have been built (Lindstedt, 2016), as shown in Figure 1.
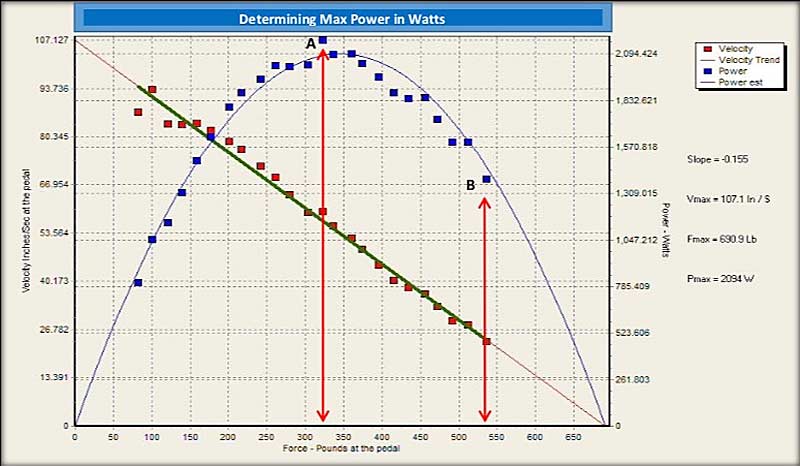
If we chart the power output at each resistance over a force-velocity curve, we are able to derive our parabolic power curve. The apex of the curve will indicate the resistance at which maximum power (Max Power), is achieved. Max Power is theoretically used to delineate the relative emphasis of force versus velocity at any point on the force spectrum.
Any resistance greater than Max Power will have a strength bias and any resistance less than Max Power will have a velocity bias—i.e., two resistances on opposite sides of Max Power on the power curve can have the same power output, but the resistance to the right of Max Power will have a greater force bias. The prevalent resistance that has been published for Max Power is ≈60% of a 1RM for both free weight squat and bench-pressing movements. See Figure 2.
Author’s Note: One important variable to keep in mind when referencing published subsection velocities is that the velocities articulated only cover the velocity spectrum in regard to free weights. Recent investigations have confirmed that velocity is substantially greater at each resistance when using pneumatic resistance versus free weights. However, the order of subsections along the intensity spectrum does not change. (Frost, 2008)
Delineating Critical Subsections
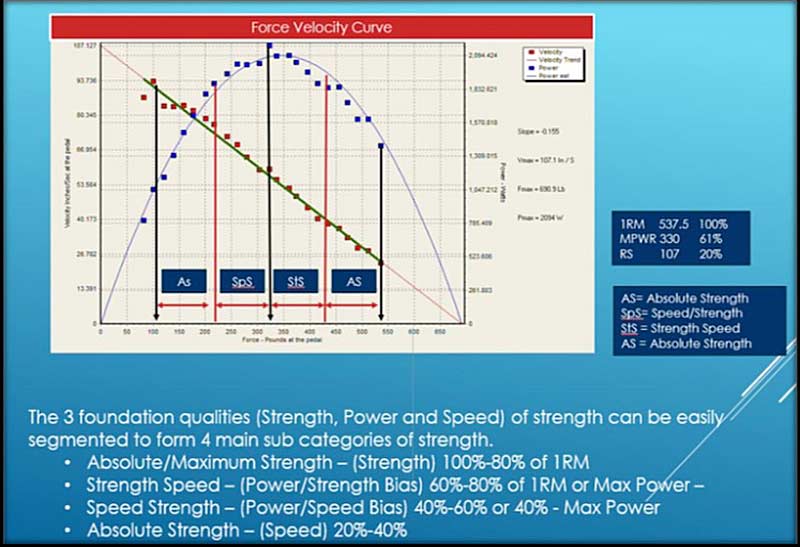
The subsections in this article are given as a general reference to understand the importance of the relationships between power, velocity, and force. Many authors and researchers have published data using both velocity-based training (VBT), and percent of 1RM to distinguish these zones. Regardless of the method used to define zones, the central takeaway for application purposes is that strength and speed are not exclusive across the force-velocity curve. In its most simplistic view, the ends of the force-velocity curve represent absolute strength and absolute speed respectively, and the middle of the power curve expresses the highest power values.
Regardless of the method used to define zones, the central takeaway for application purposes is that strength and speed are not exclusive across the force-velocity curve. Share on XThe qualities listed below give a general interpretation based on the literature available. The protocols that I offer are adopted and based on USTFCCCA strength protocols and 25 years of pragmatic experience working with elite athletes. Velocity is inversely proportional to resistance. Nonetheless, each concentric repetition across the strength continuum must be attempted as fast and as explosive as possible.
Absolute Strength[Force Development](Maximal Strength, Accelerative Strength*)
This zone has schemes that are performed where the protocol (load) requires maximum muscular contraction to execute a repetition at or near a 1-rep maximum regardless of the rate of production (velocity). This zone covers a 20% area on the force axis with up to five reps. Nevertheless, Absolute Strength has been shown to be maximized at loads ≥ 90% of a 1RM performing 1-2 reps. The 80-90% zone should be used to prepare a subject for loads ≥ 90%.
Qualities
- Resistance: High to very high
- Velocity: Low to very low
- Power Output: Low to moderate (Power output decreases as intensity moves towards 100% due to a decrease in velocity.)
Protocols
- Reps: 1-5
- Sets: 4-8
- Total Reps: 15-30 per region
- Number of Exercises: 1-2
- Intensity: 80-100%
- Recovery: Complete
Max Power[Power Development](Basic Power Development)
This zone has a scheme that is performed where the protocol (load) displays the greatest amount of power as expressed in watts. This zone is executed at ≈60% of 1RM or at the Keiser Optimal Power Resistance up to six reps.
Qualities
- Resistance: Moderate
- Velocity: Moderate
- Power Output: Very high
Protocols
- Reps: 2-6
- Sets: 4-8
- Total Reps: 16-40 per region
- Number of Exercises: 1-2
- Intensity:≈60%
- Recovery: Complete
Strength – Speed [Power Development/Strength Bias] (Basic Power Development)
This zone has schemes that are performed where the protocol (load) requires near maximum to moderate muscular contractions to execute a repetition with a secondary emphasis on the rate of production (velocity). This zone occurs within the summit of the power curve with a prime emphasis on strength. This zone covers a 20% area on the force axis with up to five reps, yet maximum power production will be maximized at ≈60-70% or Max Power plus 10%. If you are measuring power output on each rep, you should terminate the set if Peak Power drops by more than 10%.
Qualities
- Resistance: Moderate to high
- Velocity: Moderate
- Power Output: High to moderate (Power output decreases as you move away from Max Power.)
Protocols
- Reps: 2-5 (Terminate set if Peak Power drops by more than 10% on multiple reps.)
- Sets: 4-9
- Total Reps: 18-36
- Number of Exercises: One with variations allowed in regard to range of motion
- Intensity: 60-80% or Peak Power plus 20%
- Recovery: Complete
Speed – Strength [Power Development/Speed Bias] (Basic Power Development)
This zone has schemes that are performed where rate of production (velocity) takes precedence over force, making (load) secondary in nature. This zone occurs within the summit of the power curve with a prime emphasis on speed. This zone covers a 20% area on the force axis with up to six reps, yet maximum power production will be maximized at ≈50-60% of a 1RM or Max Power minus 10%. If you are measuring power output on each rep, you should terminate the set if Peak Power drops by more than 5-10%.
Qualities
- Resistance: Low to moderate
- Velocity: Moderate to high
- Power Output: Moderate to high (Power output decreases as you move away from Max Power.)
Protocols
- Reps: 3-6 (Terminate set if Peak Power drops by more than 10% on multiple reps.)
- Sets: 4-9
- Total Reps: 27-45 per region
- Number of Exercises: One with variations allowed in regard to range of motion
- Intensity: 40-60% or Peak Power minus 20%
- Recovery: Complete
Absolute Speed – [Speed] (Reactive and Elastic Strength)
This zone has schemes that are performed where the rate of production (velocity) is the single most important variable. These schemes are designed to exploit a high degree of elastic and reactive qualities. Exercises within this zone often need to be adapted into ballistic movements when using free weights to achieve the desired effects—i.e., barbell back squats to jump squats.
This zone occurs well outside the summit of the Peak Power curve with a prime emphasis on velocity. However, you should implement this zone with care, especially when training the lower limbs, because of the spinal loading and impact required during ballistic movements. This zone is typically reserved for older athletes who have a higher training age and a solid foundation of Absolute Strength, basic power, and general strength development. (Schexnayder et al, 2014)
Qualities
- Resistance: Very low to low
- Velocity: Very high to high
- Power Output: Low to moderate (Power output decreases as you move away from Peak Power.)
Protocols
- Reps: (5-12)
- Sets: (3-8)
- Total Reps: 40-84
- Number of Exercises: 2-3
- Intensity: 20-40%
- Recovery: Enough to ensure quality of work
The Why (and How)
As a performance professional, your first question should be “why?” when creating and implementing training schemes. Why will implementing training schemes for Absolute Strength, Strength Speed, Speed Strength, and Speed help improve athletic performance? There is a large body of literature that shows that resistance training can increase strength, power, and speed, which are the skills commonly needed in many sports. (McGuigan et al, 2012) The missing element in that statement is the extent to which sports performance is actually improved when we get stronger, more powerful, and faster in the weight room. Does the weight room transfer to the field of play?
Resistance training allows us to display strength, power, and speed during an exercise that may or may not translate into improved athletic performance. The ability to evaluate an athlete’s strengths and weaknesses in relation to the key performance indicators (KPI) of their specific sport will help a performance specialist create and implement effective training protocols. Training plans must not only be specific to the individual; they must be explicit to the task or tasks being performed on the field of play.
Practitioners must always ask one simple question: How will this protocol improve performance on the field of play? Share on XUnderstanding the qualities and protocols along the strength continuum arms the performance coach with the tools needed to incorporate training modalities specific to an individual trying to complete a specific task. Two athletes quite frequently need different stimuli to accomplish the same task. Practitioners must always ask one simple question: How will this protocol improve performance on the field of play?
Author’s Note: It cannot be overstated that the extent to which improvements can affect human performance is dependent on many variables, including (but not limited to) the individual’s specific physical qualities, the physical skills required for explicit activities, mental competency, environmental conditions, sport competency, and exercise selection. Effective implementation of resistance training through an integrated periodized training plan that has measures to control intensity, volume, and density will also play a key role in determining the overall effect in a resistance program.
References
Bondarchuk, AP. (2014) Olympian Manual for Strength and Size. USA: Ultimate Athlete Concepts, Michigan.
Cormie, P. et al. (2007) “Optimal Loading for Maximal Power Output during Lower-Body Resistance Exercises.”Medicine & Science in Sports & Exercise. 39(2):340-349.
Frost, D.M., Cronin, J.B., and Newton, R.U. (2008). “A comparison of the kinematics, kinetics and muscle activity between pneumatic and free weight resistance.” European Journal of Applied Physiology. 104;937-956.
Lindstedt, S. (2016). “Skeletal muscle tissue in movement and health: Positives and negatives.” Journal of Experimental Biology. 219(2):183-188. 10.1242/jeb.124297.
Mann, B. (2016) Developing Explosive Athletes: Use of Velocity Based Training in Training Athletes. USA: Ultimate Athlete Concepts, Michigan.
McGuigan, M.R., Wright, G.A., and Fleck, S.J. (2012). “Strength Training for Athletes: Does It Really Help Sports Performance?” International Journal of Sports Physiology and Performance. 7, 2-5.
Pfaff, Dan. (2018) Personal communication.
Schexnayder, B. et al. (2014)USTFCCCA Strength and Conditioning Certification Manual, USTFCCCA Track and Field Academy, New Orleans.
Schnolinsky, G. (2006) Track and Field: The East German Textbook of Athletics. Sport Book Publisher, Toronto, Ontario, Canada.
Stone, D.A., Cronin, J.B., and Newton, R.U. (2008). “A comparison of the kinematics, kinetics and muscle activity between pneumatic and free weight resistance.” European Journal of Applied Physiology. 104:937-956. doi 10.1007/s00421-008-0821-8
Strength-Endurance Continuum [Def.1] (n.d.). InThe Oxford Dictionary of Sports Science & Medicine Online, Retrieved September 11, 2018.
