In an earlier blog entry, we discussed practical steps to take to enhance the accuracy and reliability of data collection in strength training, practice, recovery, and competition. The core concept of enhancing data reliability centers on the steps that coaches, trainers, practitioners, and sports scientists will take once the data is collected and organized, and primary analysis begins. With so many tools and methods available to collect data in sports, practice, and training, what can coaches and sports scientists actually do to start assessing and improving performance?
A practical starting point is assessing how data is being collected and organized in research conducted on sports performance. Popular technology such as global positioning systems (GPS), accelerometers, and heart rate monitors (HRM) are increasingly prevalent in research performed on team sports performance. However, the concepts used by researchers with these tools can be broadly applied to physical activities beyond competition and practice alone.
In 2014, Dellaserra et al., published a review of integrated technology (IT) use in team sports that highlighted opportunities, challenges, and future directions for their use in performance analysis [1]. Understanding the foundational methodology of data organization of both objective and subjective metrics is a key first step to effective performance analysis. As they organize all objective and subjective data, each practitioner will ultimately work to identify key performance indicators (KPIs) matching their program’s goals and philosophies. Forming KPIs is an essential portion of the sports science analysis process, and should be done on an individual process. The KPIs of one particular university, team, or facility may be totally different than the KPIs from another, yet each set will optimally serve each institution based upon their needs.
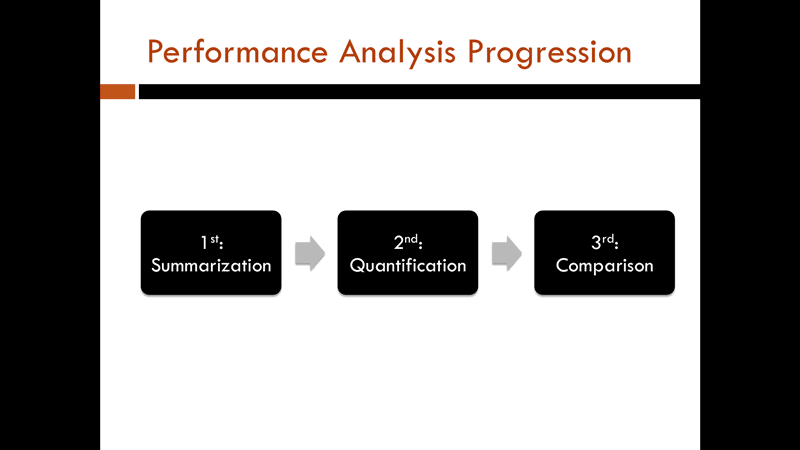
This second installment of the sports performance article series outlines and adapts the main points of the Dellaserra et al. review to provide useful steps as to how data can be organized once you and your staff have started collecting data on performance, training, recovery, or readiness. Consider the following elements once you start data collection: summarization, quantification, comparisons, and bioenergetic demands.
Summarization
After data is collected during activity, practitioners can begin organizing it into categories. This process may also be provided or supplemented by using the software accompanying the specific IT devices used. Data collected manually can be input to existing athlete management systems (AMS) or simple spreadsheets. Summarization can occur each day post-activity as data is uploaded via interfaces provided by each manufacturer of the tech devices used. Practitioners will then be able to produce summaries from the data collected during the activity of that day.
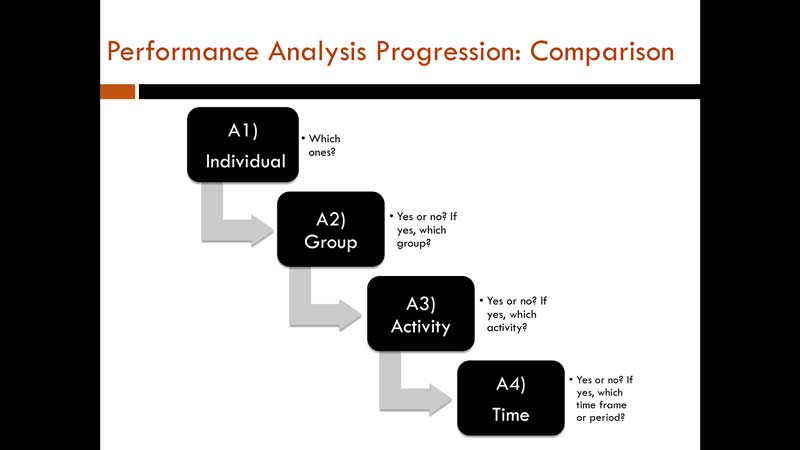
The basic descriptive summaries of totals, minimums and maximums, means, medians, and all other values of parameters measured can be classified by the following categories and subcategories:
Individual Parameters
- By individual player: for example, player A, player B, etc.
Grouping Parameters
- By position groups: such as all offensive linemen, freshman midfielders, or transfer point guards.
- By depth chart standing: such as all first-string players, all second-string players.
- By depth chart and position: such as all first-string guards, all redshirt pitchers.
Activity Parameters
- By drill or practice sequence: such as Individual or Grouping parameters during a specific drill. For example: player A during 1-on-1 drills, first-string wide receivers during 7-on-7 drills, or all central defenders during set-piece drills.
Chronological Parameters
- By day of the week: such as Monday practice, “game day minus 2,” walk-through session, summer conditioning, etc.
- By week of the season: such as week 1 of pre-season camp, or week 3 of the season versus opponent “X,” or bye week.
- By portion of the season: such as daily doubles or pre-season, post daily doubles preseason, in-season, post-season conference championship, playoffs, and bowl preparation.
- By time of year: such as off-season training periods, off-season practice periods, pre-season camp, in-season.
Injury Status
- By injury designation: such as pre- and post-injury, by rehab process or phase of treatment.
Quantification
Summarization of information can be applied to many parameters reported by IT devices or manual data collection in ways that produce discrete or continuous data. Remember, discrete data is data that can only occupy one distinct and separate value, like the number of pitches thrown (because you can’t throw half a pitch), number of repetitions completed in an exercise (because half reps are not counted in a certain test), or sleep quality rating on a scale (because you only offer a 5-point scale on sleep quality). Continuous data can be measured and take on any value on a scale possessing intervals between whole values, such as a bodyweight of 185.5lbs (because there are weight intervals between 185 and 186 pounds), or running a 40-yard dash in 4.44 seconds (because there are other time intervals between 4.40 and 4.50 seconds) [2,3].
Metric quantification has been part of strength & conditioning programs for decades. Share on XThe data points serve as quantifications of these parameters and are represented by numbers in the form of maximums, minimums, ranges, totals, and averages. As noted above, these quantifications can apply to both activity parameters and chronological parameters dealing with various individuals or groupings. Specific parameters may differ by software or methodology; however, several main themes include:
- Maximums – acceleration rate, speed, heart rate, heart rate recovery, heart rate variability, skin/core temperature, mechanical intensity, perceived exertion, jump height or distance, weight lifted for specific reps, and physiological intensity.
- Minimums – speed, heart rate, skin/core temperature, mechanical intensity, physiological intensity, sprint time, and training intensity.
- Ranges – heart rate, skin/core temperature, mechanical intensity, and physiological intensity.
- Totals – acceleration count, distance covered, distance covered within speed ranges, time spent within speed ranges, time spent within heart rate ranges, caloric expenditure, volume of weight lifted, mechanical load, physiological load, and training load.
- Averages – acceleration, speed, heart rate, heart rate recovery, heart rate variability, skin/core temperature, mechanical intensity, physiological intensity, and training intensity.
Keep in mind that metrics quantification has been part of strength and conditioning programs for decades. The quantifying method answers questions such as: How much weight was lifted? How fast was the agility test performed? How many repetitions were performed? Objectively quantifying workloads is an essential element of measuring progress in physical performance. As introduced in Part 1 of this blog series, there are times when more subjective data is collected. In this case, the same procedures apply to organizing subjective metrics such as surveys and RPE scales.
Comparisons
Quantifications allow the practitioner to create a framework of what occurred during the measured activity. As these figures are summarized, comparisons can be made to assess the importance and implications of the data. Practitioners can use various quantifications of the individual, grouping, activity, and chronological parameters to facilitate these comparisons, which may include:
Intra-Subject Comparisons
- Using the quantification of individual parameters to compare session-to-session values of maximums, minimums, ranges, totals, and averages of various performance markers for an athlete.
- Using quantifications of individual parameters of an athlete to compare performance prior to injury, leading up to injury, and during the rehabilitation and return to play protocols for an athlete.
- Using quantifications of individual parameters to compare various chronological parameters, including values reached during the off-season, pre-season, and various portions of the competitive season.
Inter-Subject Comparisons
- Using the quantification of individual parameters to compare like values of maximums, minimums, ranges, totals, and averages of various performance markers between two athletes. This may include one starter versus another starter of the same position, or one starter versus a non-starter of the same position. This could also compare athletes of different positions.
- Using the quantification of grouping parameters to compare like values of maximums, minimums, ranges, totals, and averages of various performance markers between two groups, activities, or chronological parameters.
- Using quantification of individual or grouping parameters to compare like values of performance markers achieved during training activities, practice activities, and competition.
Bioenergetic Demands
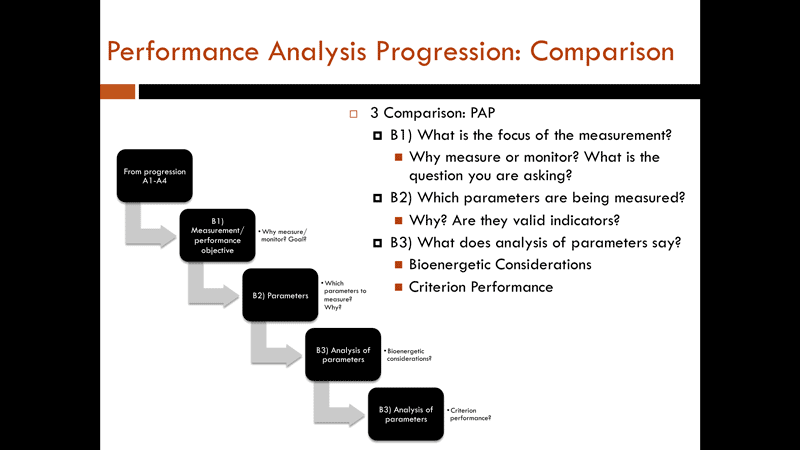
Quantified information of individual parameters of performance markers can allow practitioners to gain insight into the bioenergetic demands of the activities measured. Practitioners with a strong background in bioenergetics and exercise physiology will recognize the main energy system contributions to various types of activities. These may include anaerobic qualities such as alactic power and alactic capacity, or aerobic qualities such as aerobic capacity and aerobic power.
While understanding the various movement qualities and demands of each position, the practitioner may be able to gain insight from data on the distribution of workloads of the various bioenergetic systems. As information is gathered from training, practice, and competition settings, practitioners can compare workload distribution of each setting to determine if training and practice are preparing the athlete for the bioenergetic demands of the actual competition. When assessing the physiological or bioenergetic demands of an activity for an athlete, the practitioners may consider the following elements:
- Number of bouts: The number of repetitions during each training session, drill, or game taken by the athlete. This information is used to help establish volumes of training within specific intensity parameters with such movements as accelerations, speed, changes of direction, and other movement classifications that can be associated with specific bioenergetic demands.
- Duration of bouts: The length of time each repetition lasts during each training session, drill, or game. The information is used to further help establish volumes of training within specific intensity parameters. As more information is gathered from the number and duration of each bout, a clearer picture of the bioenergetic demands of the activity can be formed.
- Timing or frequency of bouts: The time interval between repetitions during each training session, drill, or game. Information on the timing and frequency of bouts during these activities can help further describe the intensity of the activity when other mechanical or physiological parameters are known. This is done by establishing the length of rest intervals between bouts, given the demands of each bout. The demands are further described by parameters of the activity that include speed, acceleration, or heart rate.
Criterion Performance
As bioenergetic concepts are used when monitoring changes and types of performance, practitioners must have data to serve as a reference point to make necessary comparisons. The establishment and use of criterion performances for individual athletes in each activity may assist the practitioner in this process. These criterion performances may deal with both generalized and specific data, such as maximums, minimums, ranges, and totals of physical performance markers.
Criterion performances can be established from daily best marks to monitor acute fatigue, while using all-time best marks might allow insight into states of chronic fatigue or overall physical preparedness levels. These criterion values may also be of importance during the rehabilitation process, for practitioners to use performance markers prior to injury to compare with the athlete’s current progress. Factors being assessed during training, practice, or competition will fall into one of the following categories:
Training
- Warm-up periods and all related rehabilitative or restorative protocols (stretching, range of motion, submaximal corrective exercises).
- Speed training and all variations surrounding sprinting, mechanics of sprinting, and drills related to the development of speed and agility during locomotion.
- Plyometric training and all variations, including jumps in all planes of motion, the shock training method, medicine ball throwing variations, and any other exercise focusing on optimizing the amortization phase.
- Resistance training and all variations, including strength training, power development, hypertrophy, and specialized endurance using free weights, machines, bands, chains, and any other added outside force on the body.
- Conditioning and all variations, including all activities focusing on the development of the cardiac system and aerobic energy system.
Practice
- All practice warm-up periods.
- Specialized work periods such as kickoff in football, free throws in basketball, set pieces in soccer, etc.
- Individual position-related drills, such as only running backs practicing hand-offs, or only goalies defending shots, or only point guards practicing ball handling.
- Group drills, including 7-on-7 offense versus defense, 3-on-3 drills in basketball, small-sided games in soccer.
- One-on-one competition periods, including centers versus centers in basketball, wide receivers versus corners in football, or counter attack defending in soccer.
- Team activities featuring live action in various situations such as two-minute hurry-up offense in football, final-play simulation in basketball, or sudden death in hockey.
- Non-situation-specific drills, including form tackling, free throws, rondo-passing, and other general skill development sessions.
Competition
- Pregame warm-up periods.
- Special-activity periods and specific designations such as kickoff or punt return, free throws or inbounds, set pieces, or power plays.
- Offensive or defensive drives, possessions, or efforts.
- Chronological considerations such as quarter or half, or specific time range of a game such as the last six minutes of competition in a half or game.
Practitioners must find the exact physical and physiological parameters to monitor for each individual during periods outlined above, before electing to establish a criterion performance for these activities. Practitioners should use applied knowledge of factors affecting performance of the activity to determine when an individual athlete has achieved a personal best in a meaningful activity. The establishment of these criterion performances also allows the practitioner to lay the framework for future analysis of relationships between physical and physiological markers with objective performance outcomes.
Pay considerable attention to the relevant performance markers within a specific training program. Share on XEstablishing individual criterion performances also allows practitioners to compare athletes within the same group during the same activities. These comparisons might lend insight into strengths and weaknesses of each athlete as they compare to others in the same position group. This information is useful when designing training programs with the understanding of the underlying physical and physiological mechanisms that contribute to the activity.
Considerable attention should be paid to the relevant markers of performance within a specific training program. Establishing KPIs also allows practitioners to focus on more-efficient data collection, rather than opening the floodgates to never-ending data streams. There is absolutely a time and a place for expanding performance analysis to include more data, but strengthening the fundamentals of your data collection process must take precedent. The creation of program-specific KPIs lies at the heart of sports science, but this presents a question at the heart of the matter:
What is an operational definition of sports science that captures its true effect on performance?
This definition fits well, and gives consideration to the measurement factors outlined above:
Sports Science: The discovery, interpretation, and communication of meaningful data affecting athletic performance.
Discovery: through measurement, assessment, and monitoring of athletes.
Interpretation: by field experts with content knowledge of the relevant subdomains of the sport, training, rehabilitation, nutrition, and psychology.
Meaningful: content knowledge supplied by field experts influencing the practice of “modeling” within the performance process for athletes.
While endless measurements, assessments, and monitoring of athletic performance can take place, much of the data is useless without context. This highlights the need for educated practitioners with a diverse knowledge base to help “connect the dots” of data across fields. As the data stream comes in from all areas, defining a method for analysis becomes paramount. The simple procedure of the Performance Analysis Progression will meet the needs of practitioners looking to establish a foundation for their analysis program:
Performance Analysis Progression
I developed this procedure during my time as the sports science coordinator at a Division I university. Many coaches, scientists, and researchers have their own customized approaches to looking at their data, and I developed it out of the need to look at multiple streams of data concurrently, within context.
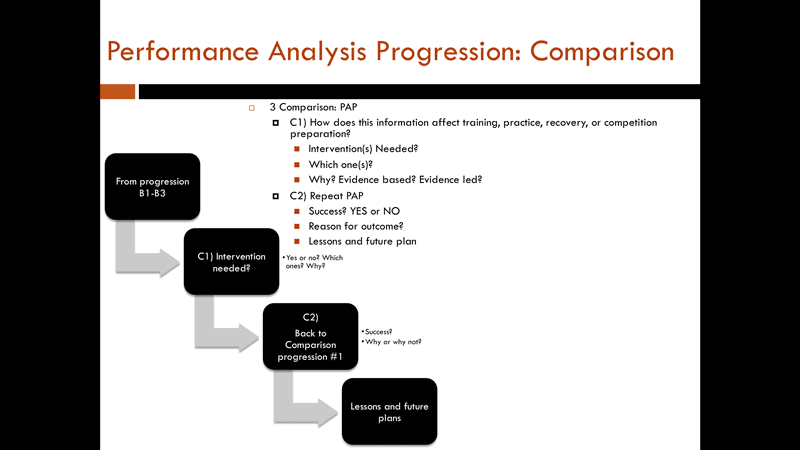
There is a simplistic progression in the order of asking questions about the data you collect, which also highlights the importance of collecting, organizing, managing, and visualizing your data via an AMS system. Consider the following progression when looking at the data from your athletes and, based on the previous descriptions of each step, define what it is you are looking for from your data:


As multiple data streams are combined to analyze performance and a system is put in place for making inquiries, managing data streams by connecting data sources and endpoints will enable practitioners to streamline this process. This element highlights the importance of an AMS that allows for customization to meet the needs of the users and the organization.
In my own experience, which is shared by countless practitioners, I grew tired of spending more time in front of a computer than out with athletes. Many strength coaches can likely relate to the reality of juggling many responsibilities at once beyond our primary duties. This includes: collecting endless streams of questionnaires at the last minute, sifting through piles of workout sheets to find one or two particular numbers, and connecting Google documents and downloading data. This is in addition to attempting to manage countless other streams that may or may not offer clarity. Not only did this process drive the need to create program-specific KPIs, but it also highlighted the need to streamline and simplify the process to meet foundational needs of sports science.
Out of this chaotic experience, I designed my own AMS, Voyager. I was familiar with other methods of managing data streams at a very high level, as well as other athlete management systems serving a high level of functionality, but I needed a simplified system for foundational sports science methodology. As I have mentioned before, the “bells and whistles” are necessary at a certain point, but there is great power in establishing a firm foundation of connectivity between athletes, strength coaches, sports medicine, sports nutrition, sports psychology, team managers, and sports scientists alike.
Analyzing the effectiveness of a training program, treatment modality, recovery intervention, or nutritional plan is not an attack on the practitioner implementing the program, but rather, it is part of the pursuit of performance that is a necessary trait of an elite coach.
As we highlight the need for connectedness and a streamlined process made possible by athlete management systems, the practicality of the Performance Analysis Progression is revealed. Think of the take-home concepts from the Performance Analysis Progression: What are we looking at? Why are we looking at it? What is it saying? What should we do? Did what we do actually work? The last question is troubling for some, because it requires that we—as strength and conditioning coaches, sports medicine practitioners, and sports scientists—assess the methodology we implement on athletes.
Nearly every good coach I have worked or spoken with over the last 15 years assesses their own performance and will not hesitate to improve their own training process. The best coaches I have worked or spoken with are tireless in their assessment of the performance of their athletes, and embrace the need to continue to refine their abilities as a professional. Therefore, sports science, as defined above, is part of a natural process that allows for the advancement of athletic performance and coaching ability. Analyzing the effectiveness of a training program, treatment modality, recovery intervention, or nutritional plan is not an attack on the practitioner implementing the program, but rather, it is part of the pursuit of performance that is a necessary trait of an elite coach.
During this current offseason period, I employed the Performance Analysis Progression while utilizing Voyager to organize in-house KPIs, Omegawave data, and training and wellness data, in addition to custom sports medicine assessments. I should also mention we had the opportunity to utilize a Freelap timing system and received exceptional, timely support from Christopher Glaeser on how to maximize use of the system to meet our specific needs. This process helped connect me with a strength and conditioning staff, a sports medicine staff, remote coaches, and a group of NFL-draft hopefuls and NFL off-season athletes.
While employing a new system and methodology creates many challenges, the connectivity and streamlining of our process based on the methodology outlined in this article allowed our team of professionals to further examine our own process. Within two weeks, we were able to identify needs for athlete education, project future adjustments in training load, and visualize progress for our athletes and their agents, coaches, and staff. We placed a particular emphasis on maximizing our use of the Omegawave Coach system, a system I have used as both an athlete and a coach. There are many ways to apply information from Omegawave screenings, wellness questionnaires, and athlete interaction to inform the training process, which will be the focus of a final article in this sports science methodology series.
Since you’re here…
…we have a small favor to ask. More people are reading SimpliFaster than ever, and each week we bring you compelling content from coaches, sport scientists, and physiotherapists who are devoted to building better athletes. Please take a moment to share the articles on social media, engage the authors with questions and comments below, and link to articles when appropriate if you have a blog or participate on forums of related topics. — SF
References
- Dellaserra, C.L., Yong, G., & Ransdell, L. (2014). “Use of integrated technology in team sports: a review of opportunities, challenges, and future directions for athletes.” Journal of Strength & Conditioning Research (Lippincott Williams & Wilkins), 28(2): 556-573. doi: 10.1519/JSC.0b013e3182a952fb.
- “Discrete and continuous random variables.” (2017). Khan Academy. Retrieved 20 March 2017.
- “CaSQ 3B – Numerical Data: What’s The Difference Between Discrete and Continuous?” (2017). Retrieved 20 March 2017.

