
Force Plates in Practice: What I Learned in My First Year

Summary
Coach Jared Lovelace walks through common mistakes coaches make when first using force plates and how they can set themselves up for success. He also discusses using Hawkin Dynamics cloud software and Power BI for data visualization to help bring your data to life..
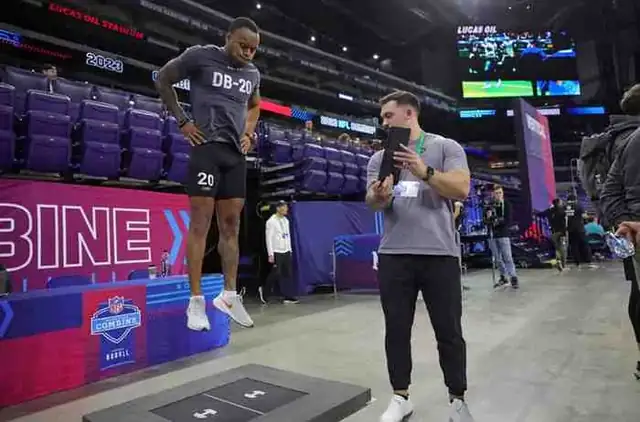
I finally got to cross the big one off my tech wishlist. When the opportunity came up last year for our department to get a set of force plates for the weight room, I was ecstatic. I work with our beach and indoor volleyball teams here, and I knew force plates would give me the insight I needed to take our training to the next level. However, I quickly realized that with new technology comes new challenges – if any of you have started using new tech like force plates or a 1080, you know where this is going.
“What the heck do I do with this thing now?”
In this article, I am going to lay out some mistakes that I made as I started implementing our force plates into training, as well as detail what I’ve learned to be best practices to maximize value with them.
The Logistics of Data Collection and Narrowing Your Focus
Once I got our force plates in and started thinking through how I was going to implement them, I created a “to test” list that was a mile long. All I could think about was: “I’m going to be able to look at so many different factors for jumping, braking, overhead strength, etc”. However, what I didn’t consider was how I was going to build up a base of normative data for so many different tests and exercises.
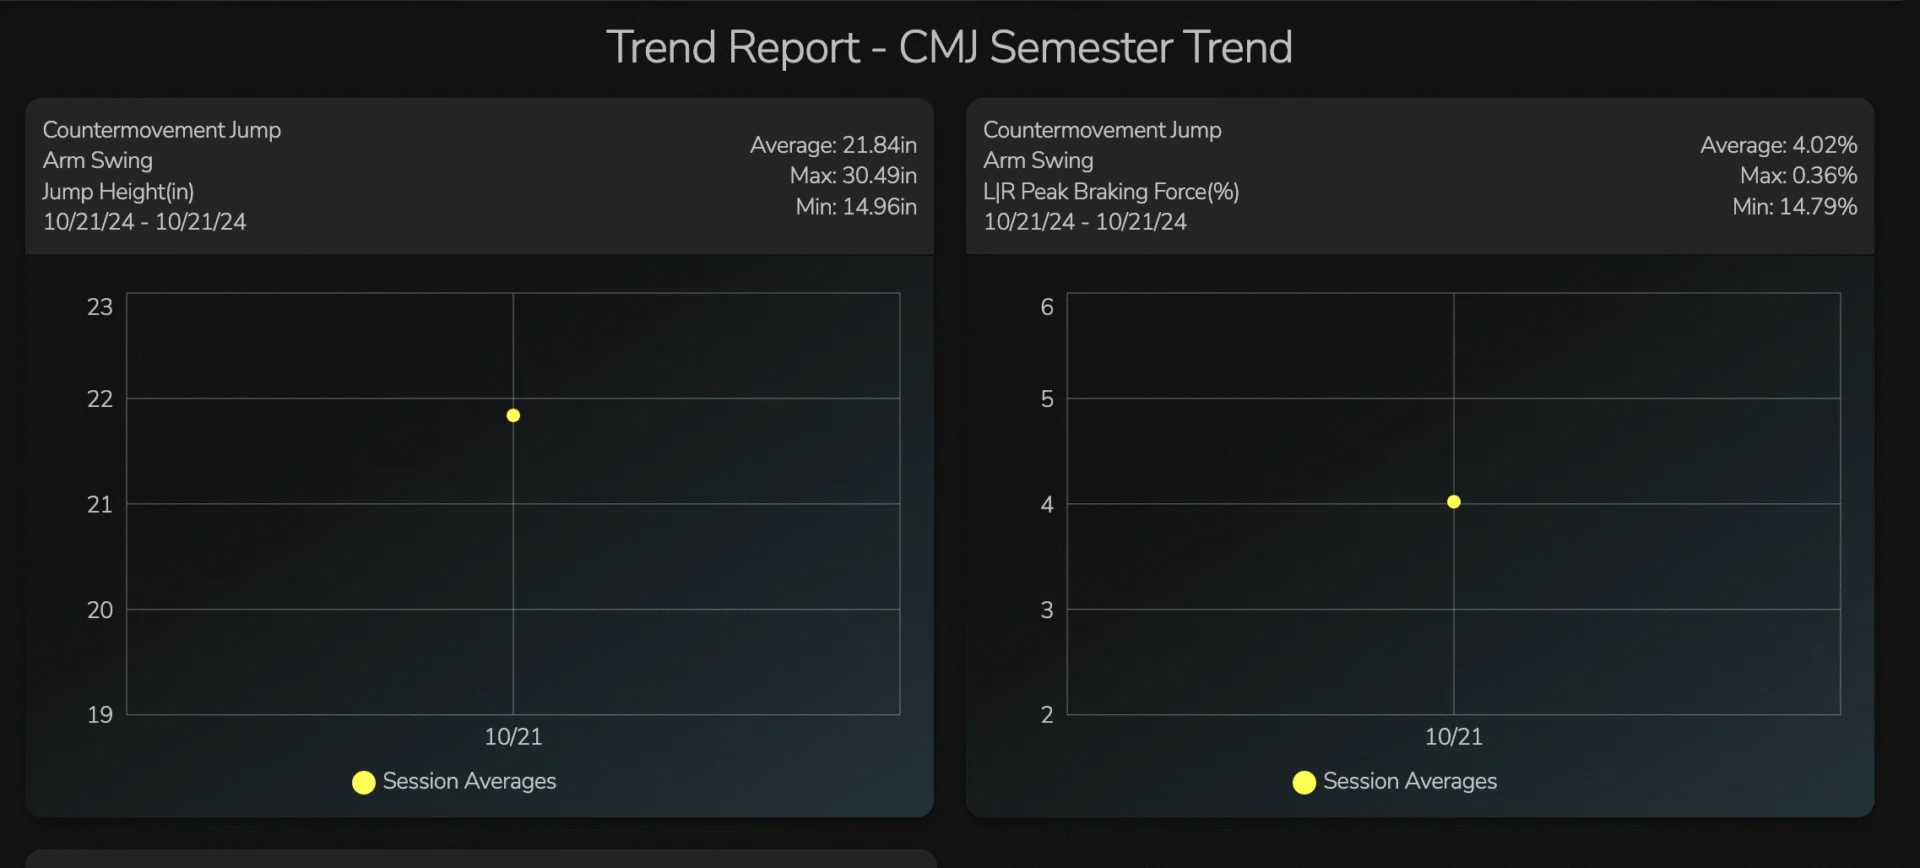
We got our force plates around September of 2024, so I took that first fall semester to work through all the testing I had been planning and, in my mind at least, build up a base to work off of in season come Spring. Once I got towards the end of the semester, I began running reports to 1) see how the training has been progressing and 2) see how I may be able to use the reports to individualize our athletes’ training in-season. What actually happened was I started running reports and realizing how little I used each individual test/tag combination for the sake of variety and “base building”. My reports looked something like this (See figures 1-3 below)
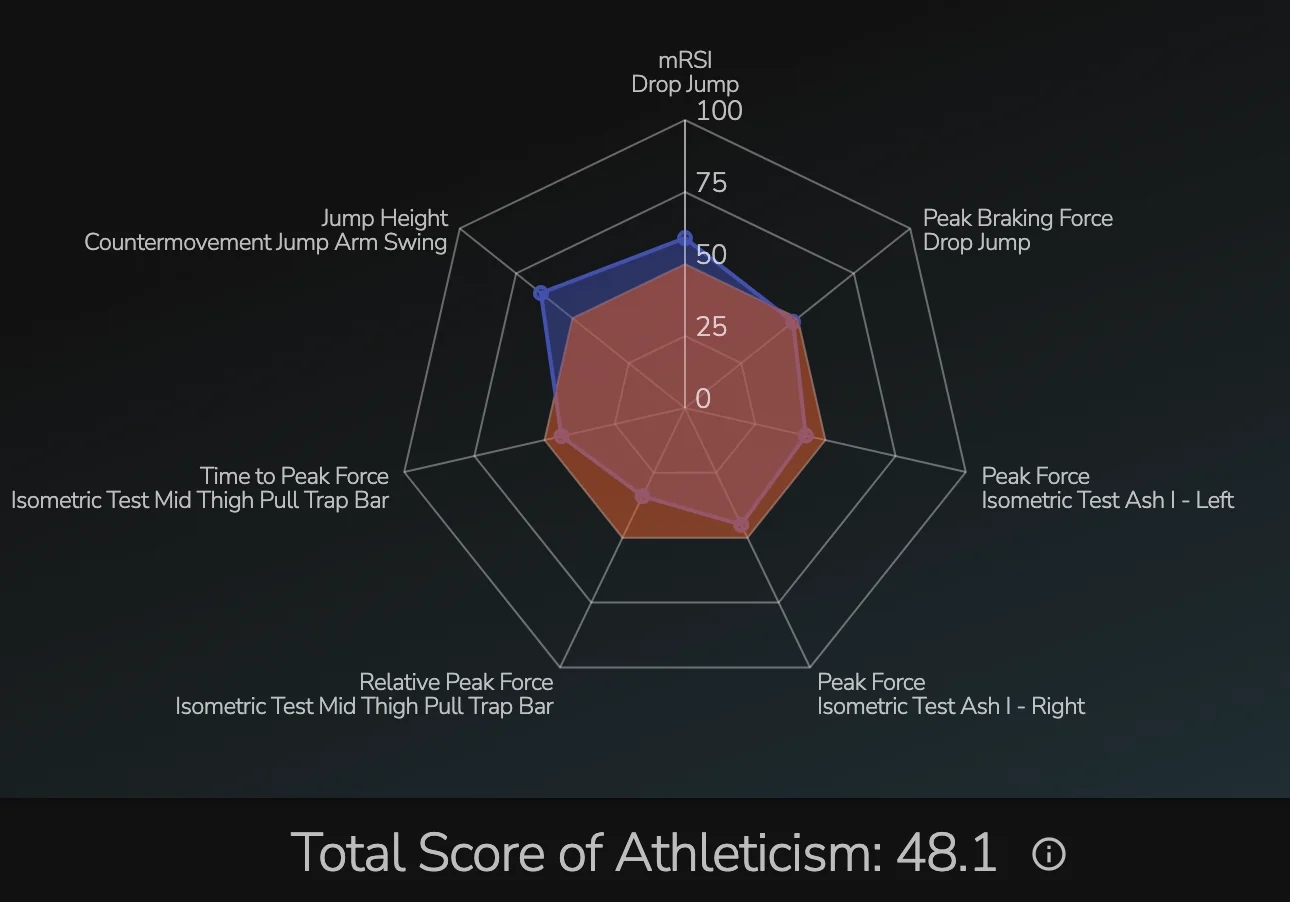
(Figure 1)
(Figure 2)
(Figure 3)
As you can see, by using too many different tests and tag combinations throughout the year, the amount of data points we accumulated for each one was far too little to have accurate trend reporting.
While I do recommend building out a robust data profile for athletes whenever possible, I now believe that when you’re first starting out, you would be better served doubling down on a few tests that will have the most correlation to their sport. For example, with my volleyball team, I wanted to look at countermovement jump (usually with arm swing tagged since that is how they jump) and depth jump. I can do both of these every single week both in and out of season and track all of my most important metrics for monitoring performance and fatigue (jump height, L|R imbalances, mRSI, braking impulse, and countermovement depth). Would I like to test other movements as well? Of course I would, but in this situation we are having to choose between going a mile deep or a mile wide. My way of adding some breadth to our testing was to collect our primary metrics on the first two days of training, and then throughout the year I would mix in some of my other tests on the third training day. This allowed me to start building a database of normative data throughout the four years of their career.
Weight Room Flow and Organizing Your Training Around Testing
One of the primary limiting factors when it comes to programming in a team setting is weight room flow and logistics. Can I make these exercises work, in this order, in this space without it becoming chaotic? This becomes an even larger challenge when you add something like force plates into the mix as you will likely only have one set to work with. If I have 40 athletes working at the same time, how am I going to have them use the force plates without it devolving into them just waiting in line?
The system I ended up using was based around Cal Dietz’s “performance circuits” and referencing Mark Hoover’s article on how he uses them.
In essence, we create a large circuit our athletes go through that will:
- Support proper neurological firing patterns
- Spread them out through the weight room to reduce the load on the force plates
- Foster competition in multiple exercises
- Create strategic bottlenecks to allow for proper rest between exercises
For me it looked something like this week to week (exercises using force plates are in bold):
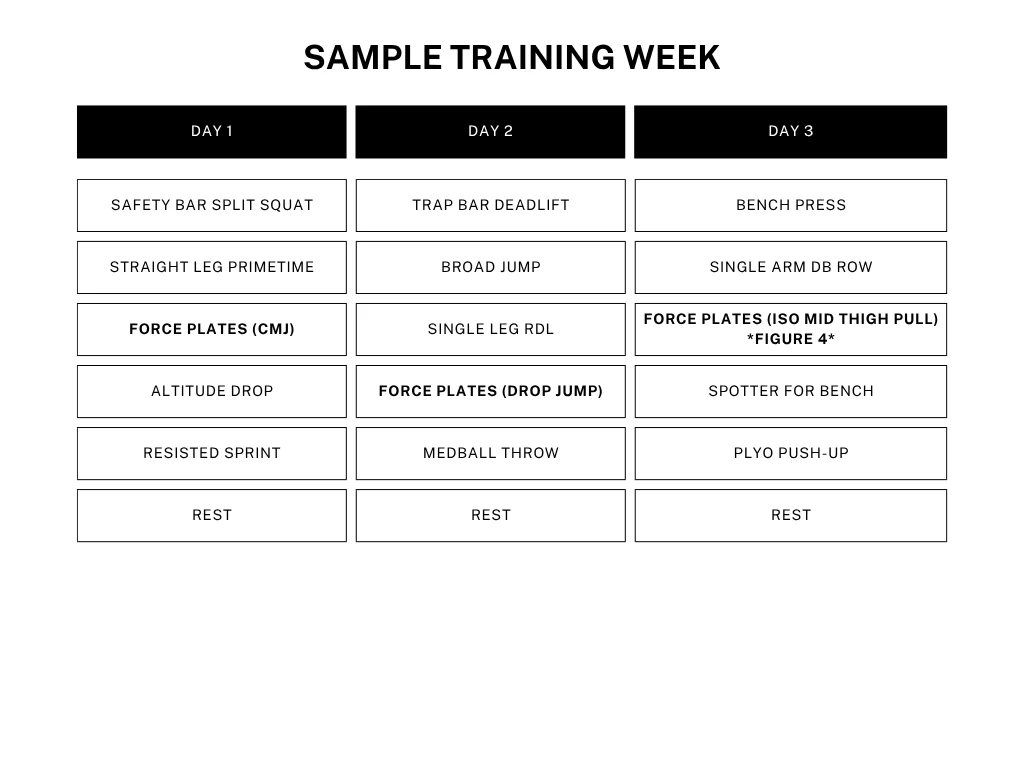
Table 1: Sample Week of Training
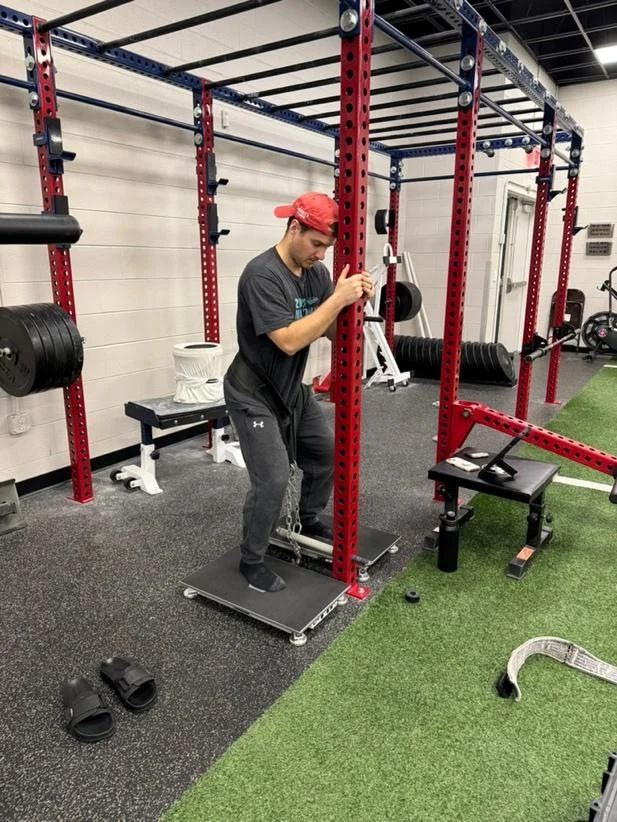
Figure 4: ISO Mid Thigh Pull
What type of performance circuit you can do is obviously going to be limited by your space. Here is what our weight room looks like that allows me to do the circuits above. The main limiting factor for me is turf space. If we sprint I can only go 12ish yards in the weight room, otherwise we need to use the hallway or the parking lot. The big takeaway here is knowing what your limitations are going to be and planning how you want to use the force plates accordingly.
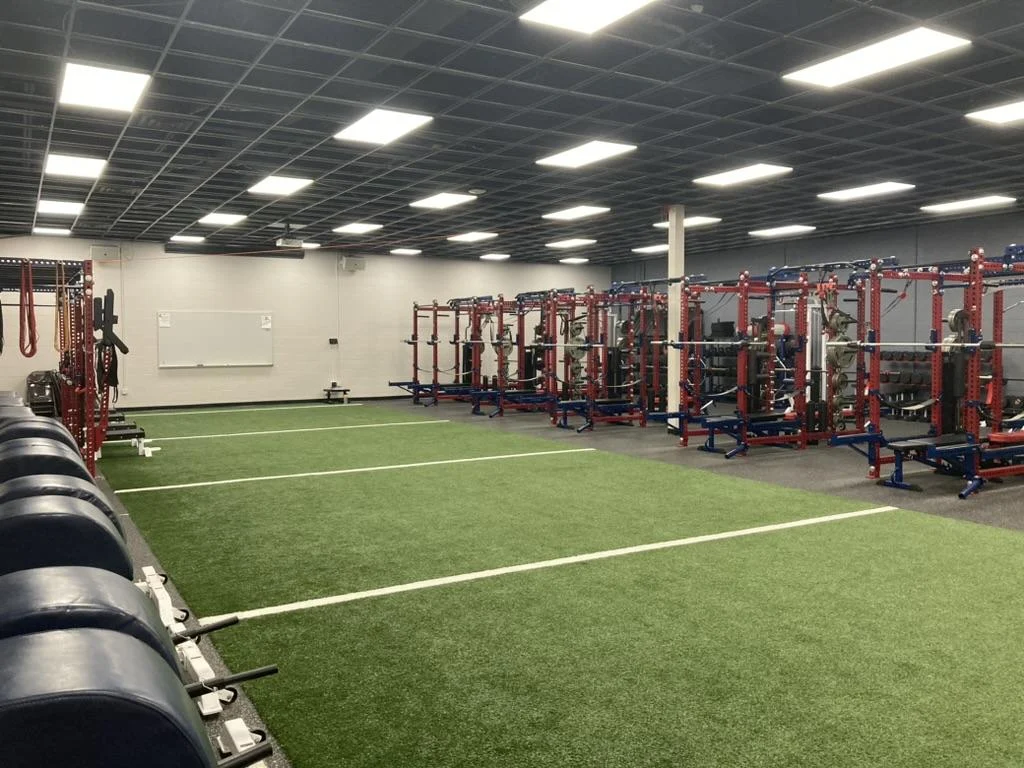
Figure 5
Data Analysis
This is the area where I felt like I needed the most help. Force plates give you so much data for every single exercise that it can become difficult to sort through when analyzing each individual. I am going to show you a couple different methods that I have found to be the most actionable way to profile our athletes and you can decide which is best for you.
Method 1: Hawkin Profile Reports
The first method is the easiest of the two by far. I started out with this as it just uses Hawkin Dynamics built in reporting in the cloud software, and doesn’t require me to do anything extra with the data. For each of my teams I picked out which exercises, and more specifically with metrics within those exercises, I wanted to focus on and built a “profile report” that included everything I chose. What is so great about the profile report is that it will allow us to compare each individual athlete against the team as a whole. The sample report below (Figure 6) is for our men’s swim team. You can see that this particular athlete is much better than the team at CMJ, about average with the Ash test and mid thigh pull peak force, and below average in braking force and time to peak force. What this allows me as the coach to do is individualize his training based on what he is lacking. So I would program lifts that focus on velocity and power to train his nervous system to produce faster contractions. Figure 7 shows a different athlete with almost the same athleticism score, but with a need to focus on strength and max force outputs instead. Your data should be giving you these types of insights that allow for actionable steps to be taken to help the athletes.
Figure 6
Figure 7
Method 2: Power BI Reporting
If you haven’t heard of it, Power BI is a reporting software that allows you to import any data you have and merge it all together into reports. This gives it two major advantages over using the Hawkin cloud software: 1) We’re not limited to only using data collected from the force plates. We can use data from other sources in addition to the metrics we track with our force plates and 2) We have more granular control and display options for our reports. You can see in figure 8 below what one of my athlete profiles looks like within Power BI. We have some of that athlete’s PR numbers listed, in-season tracking of braking and propulsive impulse, and jump/mRSI data compared to the entire team. I can then simply swap out the athlete the report is based on, and everything will convert to the new athlete I select allowing me to give individualized reports to the head coach without excess work for me. This is obviously just one example, and all the graphs/data choices you see could be changed for anything you like. You can even use Power BI to run a type of profile report like we discussed in Method 1 with Hawkin’s cloud software. The main downside to this method is that it has a significantly steeper learning curve, but once your templates are created it is as simple as importing your data and refreshing.
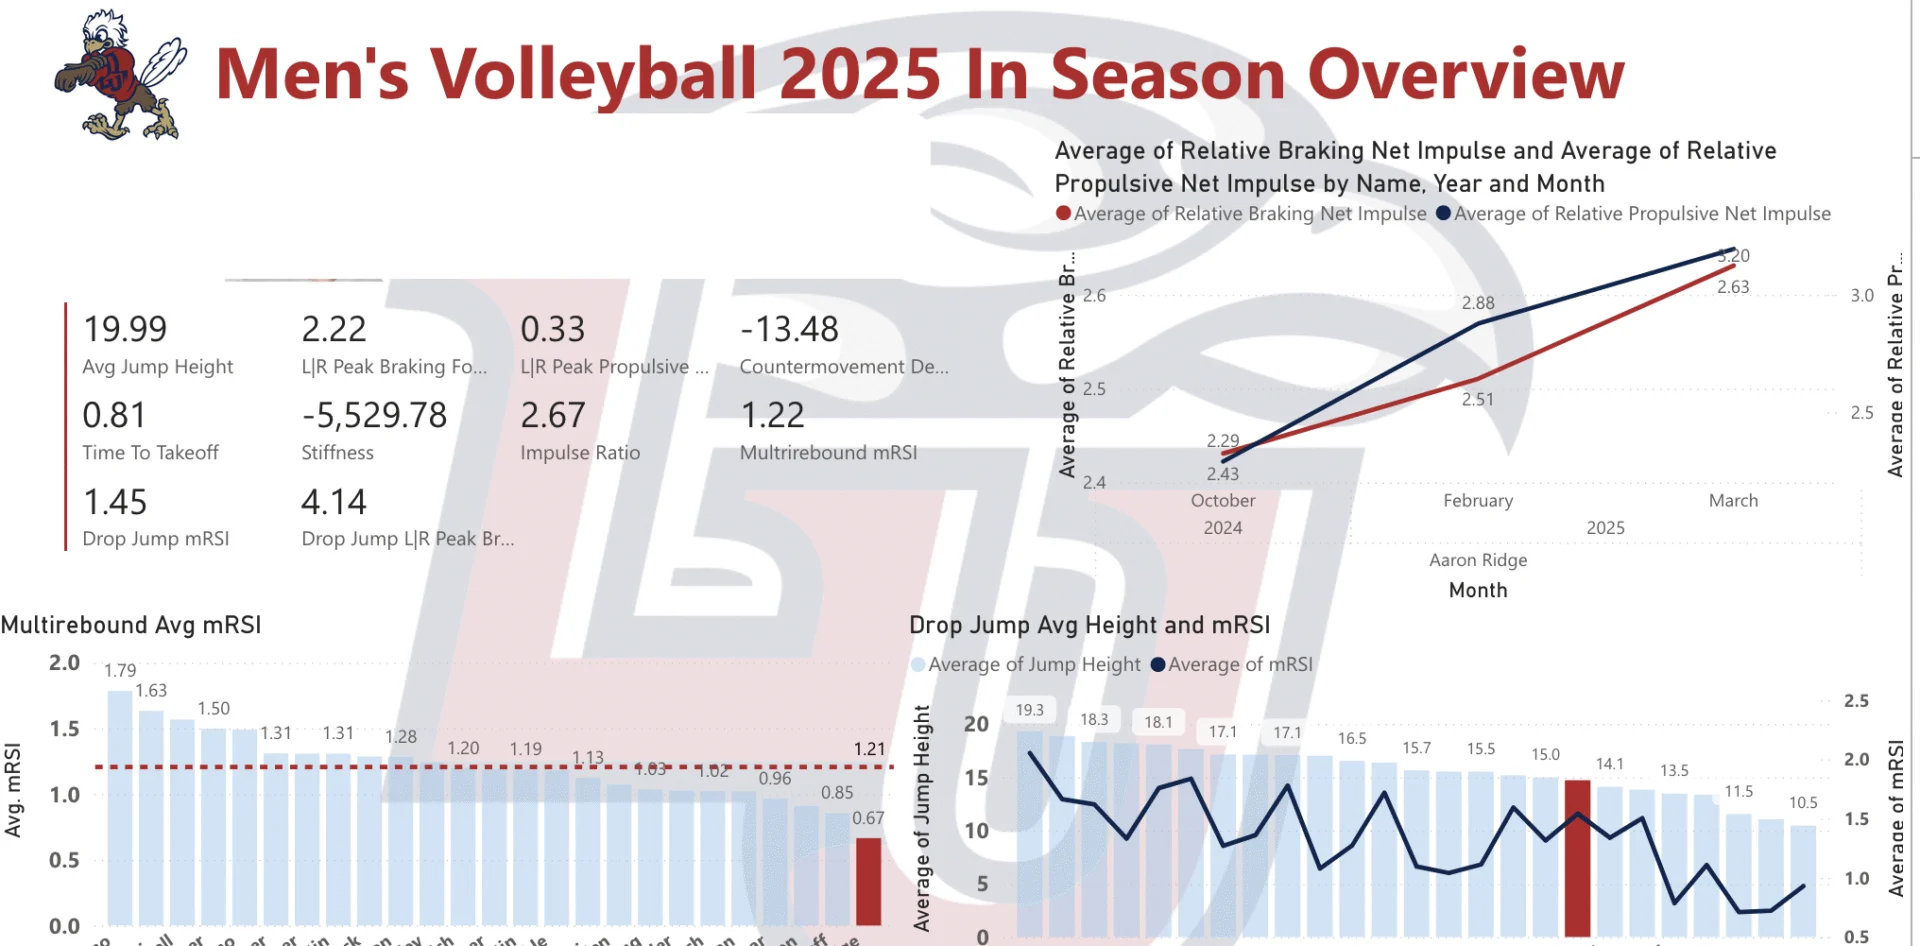
Figure 8
Conclusion
In conclusion, having technology like force plates can elevate what we do as strength and conditioning coaches to a new level. However, it also introduces new challenges that we need to have solutions for, or else you’ll end up spinning our wheels trying to keep up. If you are just starting with something like this, I recommend narrowing your focus down to what is most important to start. This will make it much easier to manage the logistics of data collection day-to-day as both you and your athletes get accustomed to the new flow. I also recommend that no matter how you decide to run your reports, you make them actionable and readable for your athletes, your coaches, and yourself. Too much data shown in a disorganized way won’t help anyone and will create more headaches than solutions. However, using this article as a guide will set you up for success and help you avoid the mistakes I made early on. If you’re interested in finding force plates that fit your setting, you can check out the simplifaster store to compare Hawkin and Vald.
If you're just starting out, I recommend narrowing your focus down to what is most important to start. This will make it much easier to manage data collection as both you and your athletes get accustomed to the new flow, says… Share on X