

The 40-yard dash is the main event of the NFL Scouting Combine. This test serves as a critical measure of a football player’s speed and explosiveness. This assessment, more than any other individual testing metric at The Combine, influences a player’s draft stock—and, therefore, the amount of money on their rookie contract.
This past January and February, I was at Bommarito Performance Systems with Pete Bommarito (where I have been for the past five NFL Combine training seasons), working with football players getting ready for the NFL Combine and their college pro days. On a quest to continue to improve training methods, we used force plate testing to determine what qualities have the highest correlation to speed and vertical jump performance. I am sure that most of you are familiar with force plates, but these are an incredible tool to assess the strengths and weaknesses of individual athletes. There are countless research articles that support the use of force plate testing to collect valid and reliable data.
In my understanding of sprinting and jumping, athletes need to produce high levels of relative force in a short amount of time and in the proper direction. Although the force plates we used can distinguish total force and vertical force, both tests were very vertical in nature (reactive strength index and isometric mid-thigh pull), so I did not expect the direction of force to give us high correlations. I was expecting peak relative force output and the speed of the force output to be our biggest predictors of sprinting and vertical jumping performance.
Impulse looks to be highly correlated with vertical jump, acceleration, and top speed. But with these tests, the higher the impulse, the worse their performance... This has been a tough one to understand, says @Steve20Haggerty. Share on XMethods
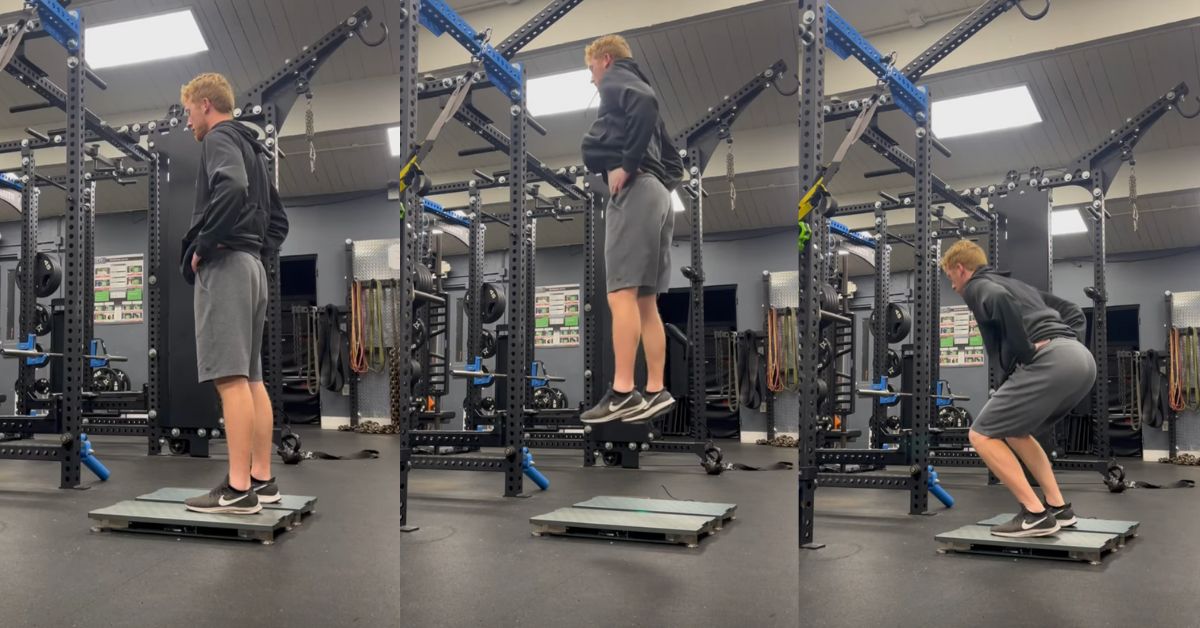
We tested 32 male college football athletes preparing for the NFL Combine and college pro days. Using the Vald ForceDecks Max we tested reactive strength index (RSI) via the “Hop Test,” as well as the isometric mid-thigh pull (IMTP). The RSI test consisted of four consecutive jumps where the players were instructed to jump as high as they can and as quickly as they can.
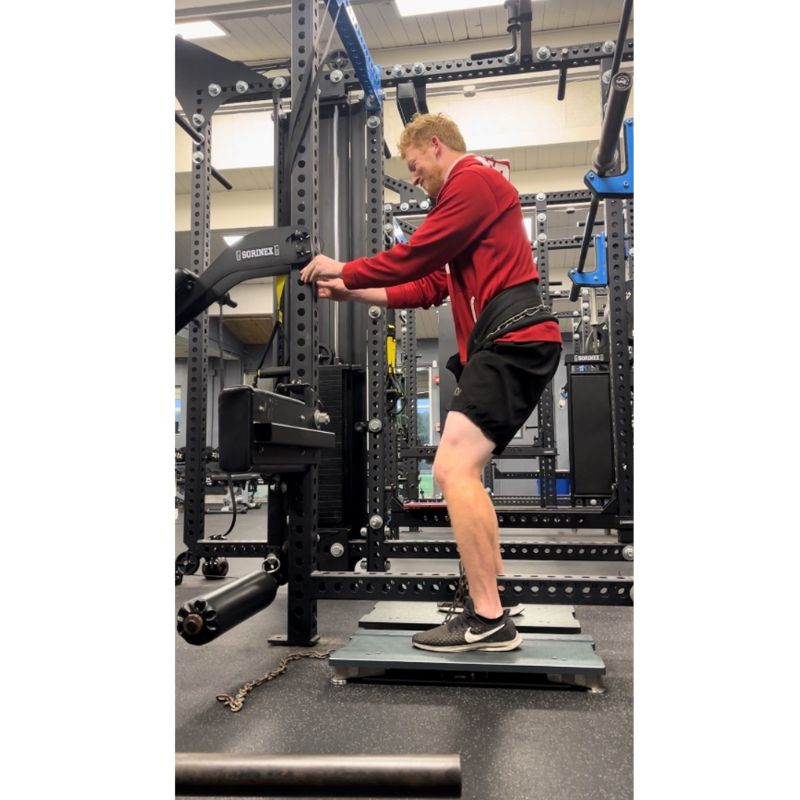
For the IMTP test, we did not use a barbell like the standard version of this test because I wanted to implement this test in a way that minimized stress on the low back. We used a chain looped around their waist and the bottom of the squat rack, which acted as an unmovable object due to its weight. This setup allowed the players to reach high force outputs without much involvement of the low back. The IMTP test lasted five seconds, with players pushing as hard as they could and as fast as they could.
Players’ bodyweight and body fat percentage were also measured regularly through the use of a bioelectrical impedance analysis (BIA).
The players were all tested on their vertical jump using a Vertec and they regularly tested their sprint times using the Vald SmartSpeed timing gates. Their best vertical jump test, 10-20 yard split, and 20-40 yard splits were used for statistical analysis.
Video 1. RSU testing on the Vald ForceDecks Max.
Statistics Simplified
Using Microsoft Excel, each of the unique data points collected from the force plates were run in a correlation coefficient with the acceleration and max velocity sprint times, and vertical jump test results. Along with determining correlations, the R2 was determined for each of the correlations. As a stats refresher, R2 represents the variance of the dependent variable that is explained by the independent variable. The larger R2 is, the more of the dependent variable that can be explained by the independent variable. This should make more sense in the tables below.
Results
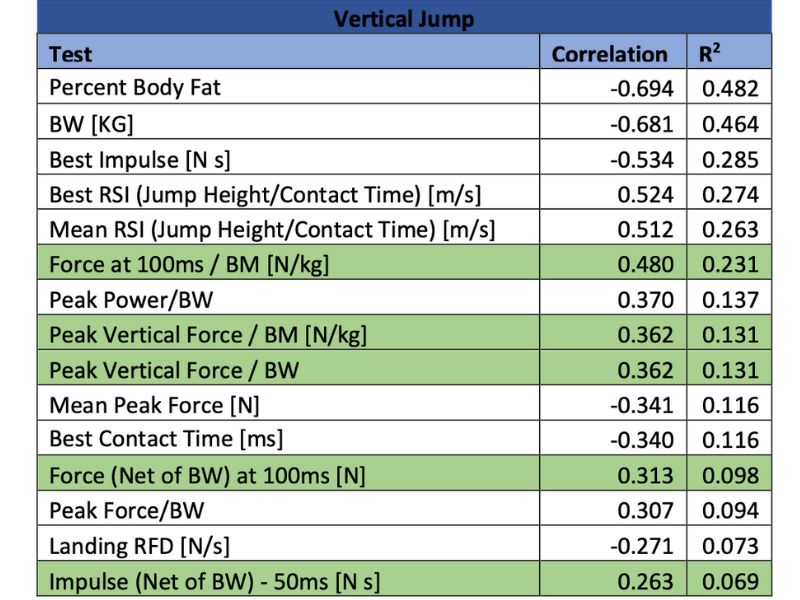
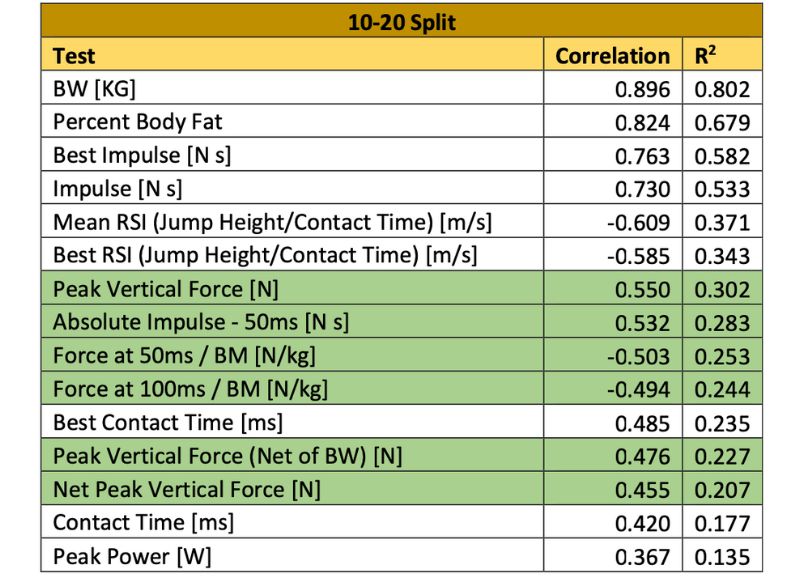
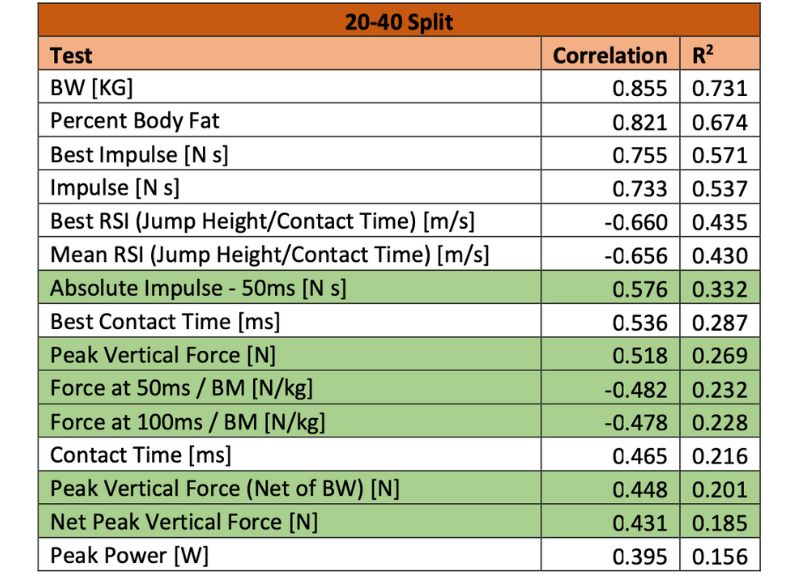
The tables below list the force plate and body composition testing, with the highest correlation to the performance tests. The highlighted tests in green were taken during the IMTP, while the remaining tests with a normal white background were taken during the RSI test or body composition testing.
Discussion
What Is Not Important
Impulse looks to be highly correlated with vertical jump, acceleration, and top speed. But with all of these performance assessments, the higher the impulse, the worse their performance in the testing measures. This has been a tough one to understand. Sprinting and jumping require large amounts of force in a limited amount of time. Impulse is the measure of force throughout the duration of time it is applied. One would think that the higher the impulse, the better. Well, in this data set, impulse is highly correlated to body mass (R = .881), and as I mentioned earlier, these testing performances depend on relative strength and force. So, maybe if we convert impulse into relative terms it will have a more appropriate relationship to jumping and sprinting? When doing so, the relationship between acceleration and relative impulse became very poor (R = .145), and even worse with top speed and vertical jump.
Impulse was taken from the repeated hop test, so what about peak vertical force from the IMTP? This is another good measure of strength in both absolute and relative terms. For both acceleration and top speed, these measures were positively correlated with speed, meaning the higher the peak vertical force, the worse the sprinting speed. Again, converting this into relative terms weakened the relationship. But unlike with impulse, at least the relationship became negative (R = -.257), meaning the higher the relative peak vertical force, the faster the sprint speed.
Power is a popular term in the strength and conditioning world. All of us coaches want to make our athletes more powerful. Power in the colloquial sense and power in terms of physics take on slightly different meanings. As you can see on the tables above, for both acceleration and max velocity, peak power was 15th on the list of correlations. Again, taking body weight into consideration and converting peak power into relative terms changes the correlations from positive to negative (the higher the relative peak power, the faster the sprint), but it would still remain 15th on each list. For vertical jump, relative peak power is much higher on the list, but carries about the same correlation as it does with acceleration and max velocity.
What Is Important
The two variables that were most highly correlated with acceleration, top speed, and vertical jump performance were body mass and body fat percentage. It should come as no surprise that these two variables are at the top, as the performance of all three of these outputs are highly dependent on mass-specific forces. Bodyweight accounts for 80% of the variance in acceleration speed, and you will always see this trend in NFL Combine 40-yard dash data—the lighter athletes run faster. Out of 22 players to ever run a sub 4.3 40-yard dash at the NFL Combine, only three of them weighed over 200 pounds and in total the group has an average weight of 185.8 pounds.

The length of time to exert force in sprinting (ground contact time) and the vertical jump are relatively different. The average ground contact time during a sprint decreases as the athlete reaches higher velocities. The length of time to produce force in a vertical jump obviously can vary between athletes, but on average is .45 seconds. The time to produce force while sprinting at top speed is very short (about .1 second), during acceleration is fairly short (around .2 seconds), and is relatively long during a vertical jump (.45 seconds). The force plate testing results reflected this.
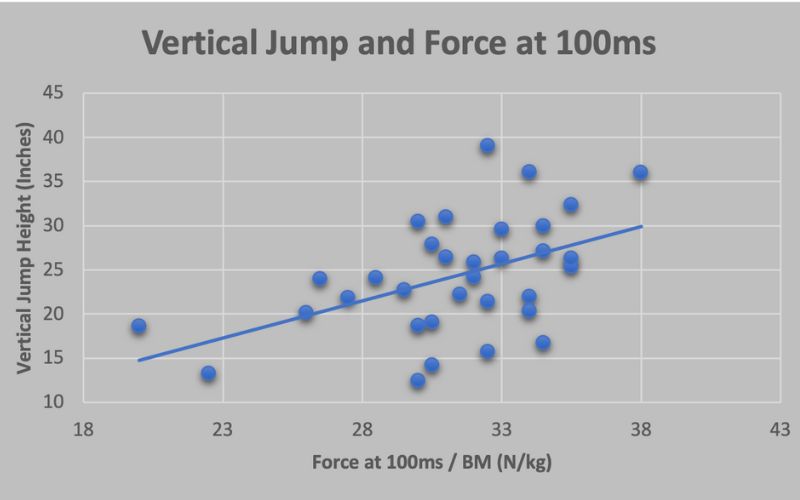
The relative force expressed at 100 milliseconds (.1 seconds) is ranked higher on the list for vertical jump than it is for acceleration or top speed. Force and impulse at 50 milliseconds are more related to top speed than either vertical jump or acceleration. The speed at which the athletes produce force is important to how well they performed at running and jumping.
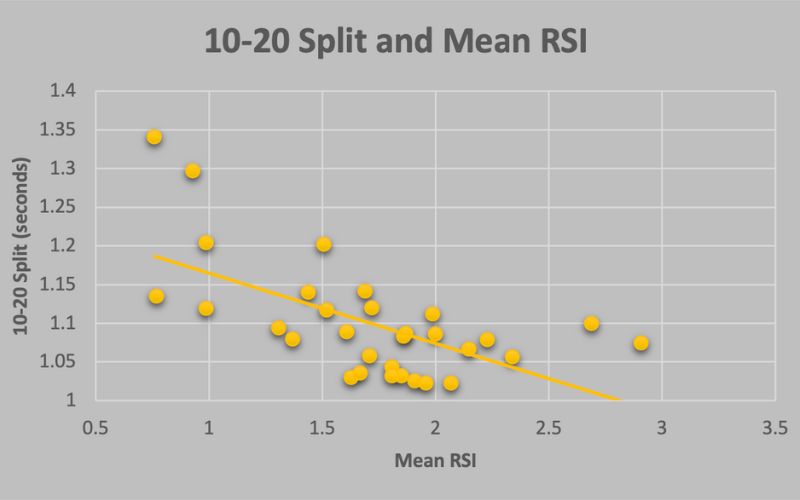
RSI and ground contact time (GCT) both had high correlations to acceleration and top speed, while only RSI made the top 15 for vertical jump. Again, sprinting has more of a time constraint on producing force than the vertical jump, so this makes sense. This further highlights the importance of producing force very quickly in order to run fast.
What To Do With This?
Bodyweight
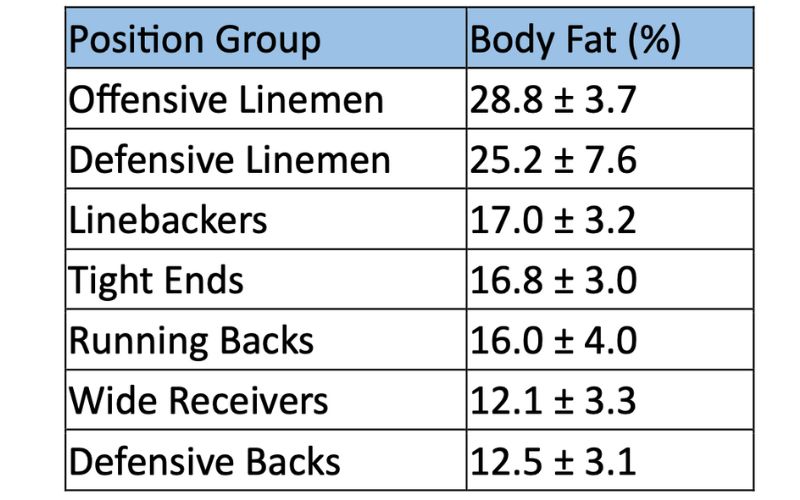
We do know that having a lower bodyweight will improve these performances, but to play football, certain positions require a certain amount of mass. We also see body fat percentage plays an important role, and that would be a better metric to change. The leaner an athlete is, the better they will perform on these tests compared to people of similar weight with less muscle mass. Okay, so maintain a good body fat percentage. For some rough guidelines for body composition for each position group, a study by Dengel et al. (2013) used DXA scans on football players leading up to the NFL draft and summer camp. They found the average body fat percentage for each individual position group (See below: Note that DXA and BIA are both valid methods for measuring body composition, but they are not the same test.
Knowing the strong correlation between body composition and both sprinting and jumping performance in NFL Combine tests, it is important for the athletes to achieve a better than average body composition for their position group. In terms of training implications for those athletes falling at below their position group average, some extra strength training volume could be utilized early on in the training process. Body composition would typically not be the main focus of training because:
- Training to perform well on the test is more of the focus.
- The amount of strength and sprint training they are doing should already be beneficial for healthy body composition.
- Adding in excess cardiovascular work in the attempt to lose body fat would potentially take away from their performance in the tests.
If major body composition changes are a priority for specific athletes, I think the majority of those changes will come from proper diet and supplementation followed by the potential for more strength training volume.
We know that a lower bodyweight will improve performance, but certain football positions require a certain amount of mass. We also see body fat percentage plays an important role, and that would be a better metric to change. Share on XProduce Force Fast
Contact time, RSI, and time specific force measures all contributed to sprinting and jumping performance. The shorter the time to apply force in a performance (1. Max velocity 2. Acceleration 3. Vertical jump), the more these variables were related to the performance. RSI has the highest correlation to max velocity, then acceleration, and then vertical jump. We see this same relationship occur with contact time and time specific force measures. Note that RSI is moderately correlated to vertical jump, but RSI uses the jump height in its equation. When just utilizing contact time in the correlation to vertical jump performance, the relationship is weaker (R = -.340). So, producing force quickly is important for all three performance tests, and is more important the faster the force express is in the performance test.
Power training in the weight room in the form of Olympic lifts, weighted jumps, and speed squats should all be a staple in this training process. Overspeed methods on the field and in the weight room such as assisted plyometrics (continuous vertical jumps, bounds, and single leg bounds) as well as assisted sprints are something that we have utilized over the past few years during this training period. I plan on using these methods even more in the future along with assisted pogo jumps, with the goal being to expose the body to faster ground contact times than it could typically produce on its own.
Proper strength training of the gastroc, soleus, and methods for Achilles tendon health (slow eccentrics and long duration isometrics) have been a part of our NFL Combine training and should be emphasized even more in the future. Using overcoming isometrics in running and jumping specific joint angles is a method I plan to use in the future. The goal should be to produce as much force as possible as quickly as possible. This would be specific to running and jumping in terms of joint angles and speed of force production, but with sprinting the muscle contraction type during ground contact is isometric just like this training method.
Even though I am a fan of tempo or time under tension training methods for certain goals, these methods do not best improve the qualities we would want to improve during this time. Unless doing these for tendon health in a smaller movement, like calf raises, I would stay away from tempo training. We know these practices can be useful, but not typically for rate of force production.
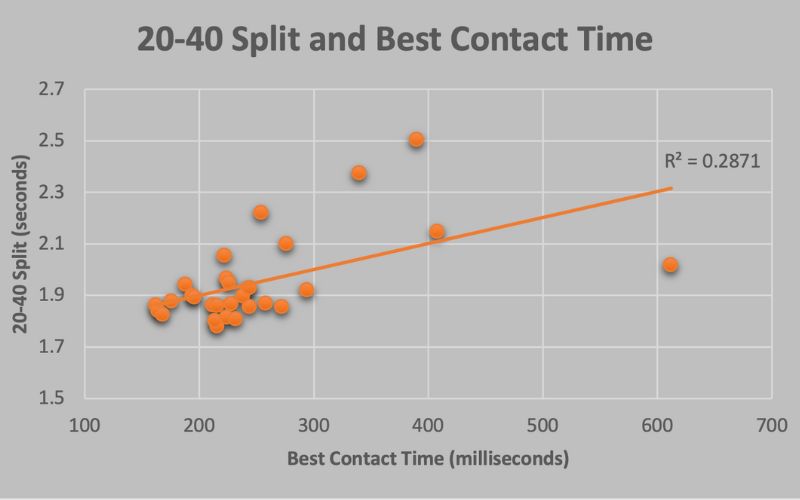
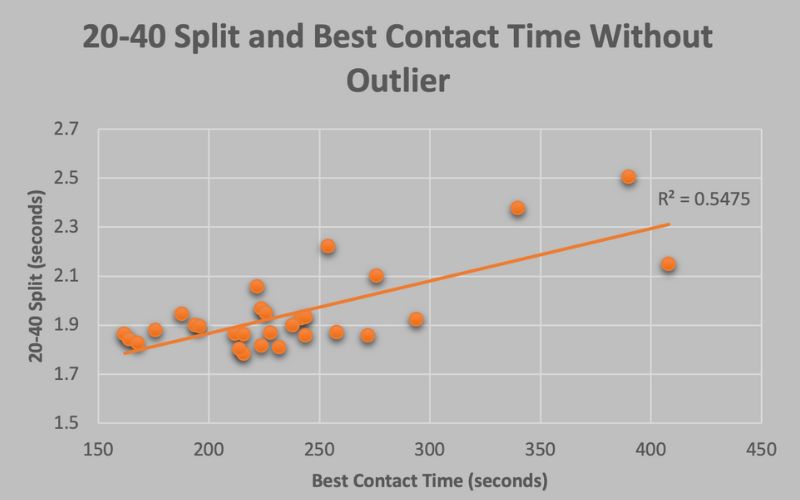
Figure 6. This is the same graph as above, but with the outlier athlete removed from the data. The R2 indicates an even stronger relationship between GCTs and max velocity sprinting speed.
Produce High Relative Forces?
The data collected suggests that peak force and impulse measured on the force plate via RSI and IMTP testing tell us very little about the athlete’s sprint speed and vertical jump performance. That was a tough pill to swallow. We know that there are very large forces relative to bodyweight produced when sprinting, and the faster the athlete the higher these relative forces typically are. Maybe a hip extension isometric test (Run Specific Isometrics from Alex Natera) would provide a better relationship? Sticking with Natera’s concepts, maybe doing the IMTP while on the ball of the foot would provide a better relationship? For now, peak force and impulse do not provide a correlation in the manner we would expect.
Being able to produce high peak forces is still a quality that we would want to see in football players, especially in linemen who need to produce high forces in a game as they try to physically move their opponents. Overall, football is a very physical game, so being strong and being able to produce a lot of force will always be important for most position groups.
Conclusion
The data suggests that bodyweight, body fat percentage, and the speed of force application would be the categories with the highest correlations to sprinting speed and vertical jump performance. Peak vertical force and impulse do not have the relationship with these performances as I originally predicted. Training for the 40-yard dash and vertical jump should spend time attempting to improve an athlete’s body composition and the speed at which they can produce force.
Peak vertical force and impulse do not have the relationship with sprinting speed and vertical jump performances as I originally predicted, says @Steve20Haggerty. Share on XIn the future, I would like to see how this type of force plate testing could lead to more individualized training programs. Understanding where an athlete is below average compared to their position group, players of similar size, or compared to their NFL Combine testing goals could help us coaches determine how to properly train them. This could help us more easily and confidently determine what their limiting factors are, and how to train to improve them.
Since you’re here…
…we have a small favor to ask. More people are reading SimpliFaster than ever, and each week we bring you compelling content from coaches, sport scientists, and physiotherapists who are devoted to building better athletes. Please take a moment to share the articles on social media, engage the authors with questions and comments below, and link to articles when appropriate if you have a blog or participate on forums of related topics. — SF


