Author Profile

Share this

Articles By Author

Mike Brown reviewing PlayerData GPS units with soccer athletes and a PlayerData intensity-map phone screen
Match-day photo courtesy of Mike Brown; PlayerData app image from article source.

Beyond the Heatmap: Using PlayerData GPS to Master Load Management and Individual Performance

A runner in an orange shirt and black shorts is sprinting on a track. Blue dots and lines mark their joints to analyze running form and adaptive speed. Trees and a field are in the background under a blue sky.

Building Adaptive Speed: How Constraint Variation Gets Transferred to Sport

Black Female Athlete Using Foam Rolling

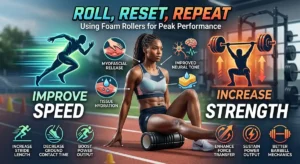
Roll, Reset, Repeat: Using Foam Rollers to Help Improve Speed and Strength

Microdosing In-Season Training

Microdosing In-Season Training: Practical Frameworks for Managing Load, Fatigue, and Performance

Pitt Sports|Feedback Loop|Sports KPIs|Value Burden Chart|Sports Science Curriculum|Sports Science Playbook|Open House
|Figure 1. Data feedback loop for sports science.|Figure 2. Identifying KPIs for different sports on campus.|Figure 3. Burden/Value quadrants

Breaking Down Walls: A Road Map for Successful Sports Science Collaboration

MMA Fighters Sparring

Identity-First Team Performance: Applied Lessons from Mixed Martial Arts

Logo of Perch on the left and logo of Vald Performance on the right, joined by a plus sign, with “PERCH” and “Vald” labeled below each logo. Text at the bottom reads “INTEGRATING THE TWO #LakerStrength.”.

Integrating Perch VBT and VALD SmartSpeed: Building a High-Performance High School Training System

The Scapula: The Hidden Key to Better Throwing Power