


While the earlier article on collecting Heart Rate Variability (HRV) indices solved the challenge of acquiring data, this piece explains how to make reasonable conclusions using that information. Monitoring is a growing responsibility for coaches and sport scientists, and this trend is not going to slow down soon. HRV is reliable and way beyond the tipping point of useful, but its in-the-trenches experience with athletes is not as common as it should be.
I have made monumental mistakes using HRV—the main one was trying to tease too much out of the data instead of moving towards other information sources. Several experts in the performance consulting ecosystem can stretch the HRV data further. The sweet spot is getting the right amount of data for your program, not just the measurement that happens between heartbeats. If you are working with a large team or school, or even only train yourself, this article is for you. Most of the information is universal in nature, so the suggestions are agnostic, but this article is geared towards the ithlete system.
The Goal of Monitoring HRV in Sport
If you were to ask a prestigious roundtable of sport scientists and super coaches that use HRV monitoring what their best practices are, everyone would give similar answers and put their own spin on things. Many secondary benefits of monitoring help athletes in general, and HRV provides an excellent objective status of the autonomic nervous system. However, let’s get right to it and not beat around the bush—the primary goal is to win more. Sure, reducing injuries, decreasing overreaching, improving player health, increasing adaptation, and learning more about training are all important.
Winning requires that talent is available and optimized in performance, not just uninjured. The fear of injury has actually increased injuries by decreasing training, as we use HRV inappropriately to chase fatigue. You can find a dysfunctional joint or tired athletes any day of the week, but taking care of their fragile state is up to professionals having enough experience to trust what they see and read.
The recent backlash against sports technology stems from jaded consultants who give casual advice without concrete ways to implement their shallow knowledge. Measurement, especially objective and standardized measures, scares those who are against the use of technology. Many coaches and sport scientists are tired of hearing from all the companies touting how they can measure fatigue and solve injury problems. While I understand their frustration, it’s time to move forward. Quality coaching is not mutually exclusive to using technology, so tools should never leave their craftsmen.
I have used the analogy that a black belt ninja is very dangerous with their hands, but give them a katana sword and they are even more lethal. Coaches must now be teachers, leaders, blue-collar scientists, and users of essential technology. Connecting with athletes interpersonally should be a prerequisite for being in the profession; it doesn’t need a book or weekend seminar, and it isn’t a CEU or revenue opportunity.
The essence of HRV monitoring is to drive a routine and accountability process for winning. While other options exist that may have similar outcomes, it wasn’t until the smartphone became ubiquitous with the general population that monitoring with HRV become a potential game changer. It’s worth repeating that routine and accountability are dying in sport, even in the age of big data and modern conveniences. The data collected from HRV can guide athletes like a compass to a training program blueprint, but only if the commitment exists with everyone. Winning requires talent and preparation, and while only a few can be on top of the mountain, HRV can increase those odds if used properly.
The essence of HRV monitoring is to drive a routine and accountability process for winning. Click To TweetHow to Design a Strategy With HRV Scores
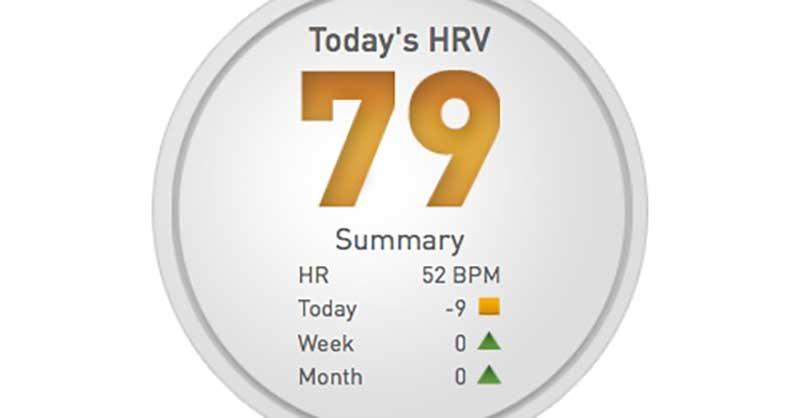
Most systems provide a summary score of an athlete’s HRV numerically first, and then include an indicator visual to alert coaches with a traffic light labelling system. A number and an interpreted conclusion sounds easy, but anyone involved in the training process will agree this is never as simple as what everyone seems to claim. I promise that, as long as you have a plan to manage the information collected, the worries of making the wrong conclusions will not surface. Most of the challenge is that, if you can’t monitor one athlete with one metric, how do you try to resolve working with a team with multiple sets of data points and multiple monitoring metrics?
My approach is four-pronged: observe, choose, act, and repeat. I use this to respond to the information I collect with many of the athletes I work with. I try, sometimes unsuccessfully, to teach this to the athletes who are on their own a lot and forced to make choices on their own in-season. Sometimes, coaches need to create a rubric or column to automate this process so athletes don’t overreact emotionally to the data.
If you can make one choice on a single athlete for one day and act on it, scaling the process is fast and easy. Most teams adopt monitoring programs in a phase approach. This means that they decide to buy a system for everyone all at once and drown in data immediately because it’s too cumbersome without intellectual infrastructure and methodology. I have rarely succeeded with athletes younger than 18 with HRV, but now the modern wearable market is making this age group, the youth athlete, more informed (yet more difficult to manage). Don’t try to do everything all at once—just try to implement a planned process.
Putting the Plan Into Action Daily
A simple workflow ensures that athletes are testing by a specific time for good habits, and helps act on any athlete’s reported needs. When an athlete uses the ithlete’s note section sometimes it’s a cry for help, while other times it’s just a way to communicate needs one-directionally. In the future, I anticipate synchronization with calendars, people, rooms, and devices after a wellness questionnaire is completed.
Why subjectively report a negative finding without following up with a naturally connected positive intervention to solve or address the change? Obviously, automation is great for many areas, but automation without communication is the reason artificial intelligence isn’t always smart. Sometimes a human filter is key, but simple things like muscle soreness and a request for massage time or a bad night of sleep and a request for a nap are just too much of a no-brainer.

After the core need for a reading, the next step in the process is to see if a change occurred that is enough to worry about. I don’t like using HRV as some sort of witch hunt or ghost chase for fatigue, but serious drops in fatigue are worth noting, of course. Improvements are nice ways to provide a little relief, but they do not explicitly indicate that the athlete should be going hard again. With the popularity of polarized programs (hard followed by easy), congruence with days feeling fresh and days feeling tired is encouraging, but don’t stress if they are not aligned.
- Red HRV and athlete requests help – Seek medical attention immediately.
- Red HRV and athlete feels OK – Check with the athlete and communicate with staff.
- Amber HRV and athlete feels sluggish or tired – Take a day off or be careful with training.
- Amber HRV and athlete feels ready to go – Are you overreaching or going a little too hard?
- Green HRV and athlete feels a little sore or off – Do what is planned but gauge warm-up.
- Green HRV and athlete feels great – Don’t go harder, just do what is planned and see.
What is not included is the use of the mood map, a way to zero in on the process by using the math behind the charting. This has helped us sharpen weekly games or save time for hard practices needed to drive adaptation. I consider targeting with the mood map an added benefit and it becomes second nature after about a month of use.
The indicator light is a suggestion, not a conclusion or diagnosis. After looking at the light and subjective reported information, you need to look at the weekly and monthly training to see if the trends are jiving with the intentions of the plan. It’s really that simple. What is hard is when the process doesn’t seem to work over a period of time, but that is not likely the fault of the system—it’s the human element of athletes or outside factors. Repeat the process the next day and continue to trust your plan, but respect the values.
Balancing the Reaction Between Objective and Subjective
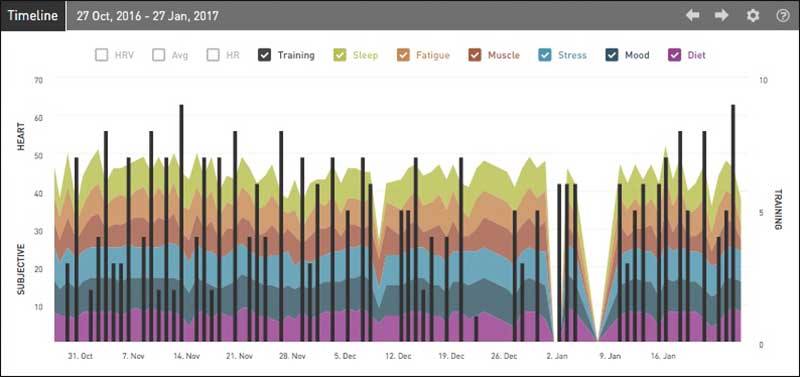
Include the wellness questionnaires to give reasons for HRV trending up or down. Using wellness questionnaires provides a quick survey of questions that are extremely powerful. Perceptions of muscle soreness, mood, dietary compliance, sleep patterns, fatigue, and life stress are the core needs for connecting to an athlete’s strain and recovery. Most teams use HRV and athlete health surveys to monitor recovery and physiological response to loading, but, honestly, it’s easy for athletes to get burnout from monitoring just as much as the actual training if the process is too much. Speed and simplicity are important, but engagement and user experience make monitoring part of the journey, not just a responsibility or burden to the athlete.
It’s easy for athletes to burn out from too much monitoring, just as they can from actual training. Click To TweetThe most important part of wellness questionnaires is perhaps not the questions and corresponding answers, but the opportunity for the athlete to communicate—without interruption—a brief entry to what they think matters with the notation logging found in ithlete and other systems. A short “message in a bottle” is gold, as it’s open-ended and can communicate so much in a short period of time. Technology can deepen connections by sharing a person’s most intimate feelings, and the use of this information shows that no analytics platform can replace a good coach with good intentions.

There are many times when data from HRV scores will not match with the words of the athlete. This is because deeper causes and effects are at play, but data not being parallel doesn’t mean that any of the information is wrong. Simple explanations are revealed by the follow-up questions, which are only possible if the initial screening questions are asked. Failure to monitor will doom many teams, but failure to follow up with additional questions is the reason teams don’t succeed with basic analog questionnaires.
It’s perfectly normal to have HRV readings not match up with what you planned or expect. After games, athletes can have great HRV readings from the aerobic stimulus and from the pleasure of simply winning. Athletes may have a perfect weekly setup for a game on Saturday, but HRV on game day might be low because they are anxiously anticipating the game.
One athlete I worked with purposely got into “stewing and brewing” for weekend competition, as this helped him drive adrenaline up through the roof and perform great. He was able to shut it down or off the rest of the week to encourage sleep and adaptation, so it isn’t a process that would work for everyone. Each athlete is an N=1, and the goal with monitoring is to support what works for them with results in training and performance, not look for statistical purity from formulas sometimes repurposed from economic modeling or other fields.
Mastering the Mood Map and Longitudinal Charts
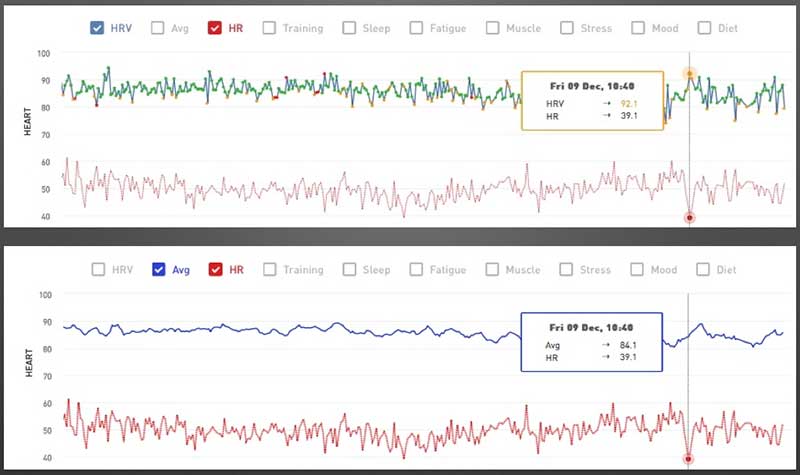
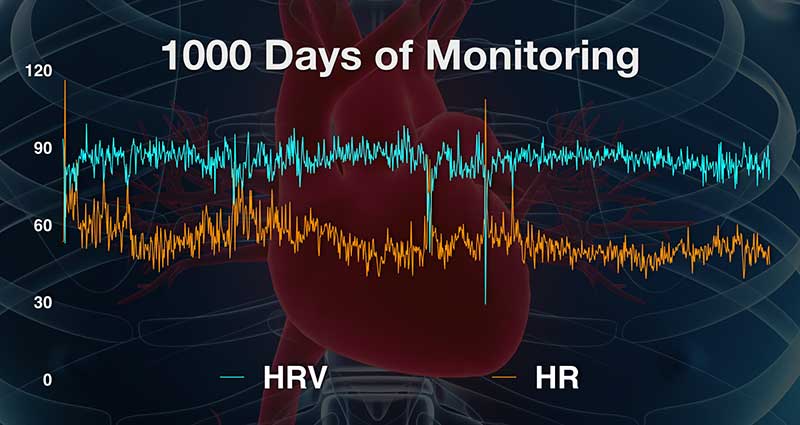
Two important and perfect visualizations are the mood map scatterplot and the longitudinal charts, which are available by clicking through the team portal. The most straightforward chart is the line plot of HRV, rolling HRV average, resting heart rate, athlete’s training load perception, and the subjective indicators shown with a fill color scheme. Daily plots of a handful of data points will be more effective than deep dives of a short period of time.

When trying to guide an athlete over a season, a simple, validated daily score will work better than any other option. I have used the data from the longitudinal chart to cross-validate other metrics, such as aerobic fitness and density errors that create immunosuppression. The trends will mainly help with training, and the collection of a year’s worth of data can help explain why seasons are successful or not.
Daily HRV – When an athlete has statistically poor HRV based on previous days, the traffic light color and mood map will take care of the core decision-making, if needed. Due to the staccato of the daily variation with some athletes, the line plot is good for recalling actual scores and indications, but hard for determining trends.
Rolling Average – The rolling average line smooths the data for a perspective that is easier to manage and to see patterns in. Averaging data is not a perfect statistical method, but this is only a problem when coaches try to make too much of a number. Again, rolling averages are perfect for weekly summaries all the way out to yearly changes.
Resting HR – A resting heart rate is the most underrated number biometrically. In the past, before HRV technology was easily accessible, the resting HR approach was a primitive way to prevent serious mistakes in training by alerting to very high changes in resting HR. A HR of ten more beats or more could spell sickness, or a drop might be fatigue. Simple eyeballing of resting HR can show that adaptations are happening aerobically, especially when HRV is trending positively. A high resting HR might not mean someone is out of shape, but that they are stressed or possibly ill.
Subjective Indicators – Personally, I don’t dissect the individual indicators very often, as the variance is usually consistent. Overall, the total rise and fall of all the indicators is a first step, and only when poor HRV patterns of data continue do I drill down further into single indices.
The collection of a year's worth of data can help explain why seasons are successful or not. Click To TweetDown-to-earth line plots help any level coach or scientist see essential information clearly, and the chart merging both the subjective and objective daily readings is super convenient. Teams can really benefit from communicating the data with each department and athletes can learn more about what is happening if they view the information at the right time with the right professional. How teams handle long-term data is really up to them, so I just focus on one day at a time myself.
The Mood Map is a special and genius way to see HRV in a pragmatic visualization. The chart has four quadrants with four intensity levels of color, all corresponding to physiological states that makes summarizing where people are easy. Distilling an athlete to one X and Y coordinate is not the intent of the chart, but the HRV data point has value in seeing the wider picture with entire rosters and historical patterns.

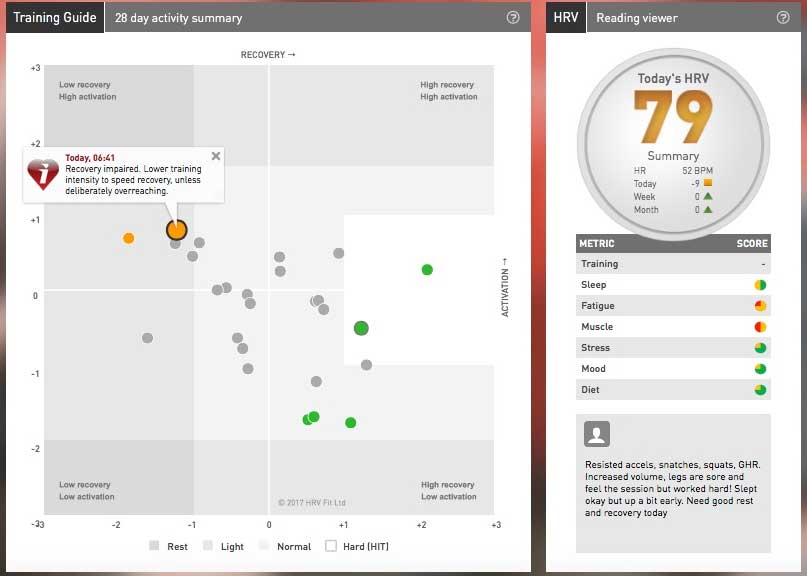
It took me a year to use this chart in a modeling approach instead of reacting by resting or just going harder. A simple guide is to try to encourage periods that allow HITT exposure, while not finding yourself in the deep corners. Fatigue is normal and necessary, so use loads and programs that taste a little residual fatigue but don’t binge on exhaustion.
How to Address HRV Scores Over a Season
The HRV line plot is a “lifeline” to me, and I divide team sport into three phases and Olympic sport into four to six phases. Pro athletes have an off-season, pre-season, and competitive season. Athletes will train with a private coach or their team coach, and the length of time before they report is up to the dedication of the player. Pro athletes may get in shape away from the team, or just get fat and lazy. Longer seasons in sport make this less likely, but a large and growing number of athletes just want to leave the area and take a mental break.
Olympic sport is cut into smaller slices because training is more impactful to winning. Athletes have a break after competition, a transition phase, a general preparation phase, a specific preparation phase, a competitive phase, and a taper for championships. It’s way too early to write a guideline to specific phase patterns, as I have only done this for six years with daily data, but I have some observations similar to Andrew Flatt with his work with Alabama.
General flows of data tend to be a slow death, a steady climb, or fluctuations as a coach reacts to mistakes or when they properly challenge athletes. A good principle is to let the harder data sets, like field tests, guide the HRV relationships first before using HRV proactively. Coaches will worry at times when their instincts don’t match the HRV readings, or when subjective data seems like it doesn’t align with good training responses. Coaches can make things easier by gaming the system and trying to have as many data points align in the right direction.

When the stars align (all data points trend properly), it’s fairly probable that training is going well. I like testing data or embedded training data, athlete feedback, and physiological monitoring. When in doubt, I look at the data that is trending poorly or the slowest to respond as an early alarm system.
I have mentioned that “good sport begins when good health ends” nearly a dozen times in other articles, as athletes find a way to compete even when they’re not at 100%. Think Michael Jordan’s “Flu Game” and other times when athletes just will themselves to succeed. Regardless of success during poor readings, chronic periods of driving on empty or with the check engine light on means breakdowns later. Borrowed time from competing short leads to dire, long-term consequences.
A proper frame of mind is just asking when fatigue is expected, at what magnitude, and, of course, if fatigue is expected at all. HRV might be spotty during early training periods, but this is perfectly normal for many programs. Unless purposely overreaching, it’s hard to see trend improvements in both performance and HRV readings. Tapering is also a mixed bag, since some athletes look like trash and respond like a resurrection at the last minute, while others make the coach look brilliant with the HRV data and perform mirroring gorgeously. It usually takes a few years to manipulate training by anticipating what is needed from HRV data, but in the first year being reactive is perfectly fine for new users.
Weird Trends, Strange Responses, and the Lack of Data
At times, HRV data will just not make sense and it will not fit neatly with other data sets, so don’t be alarmed. What happens out of the sight of a coach is a vast ocean of lifestyle choices that are up to the athlete. Training loads are easier to manage, but responses to the other hours of the day are the hard part. Be calm and patient because sometimes the data works really well for a short period of time and lessons can be taken out of the narrow window. One of the best lessons I learned is incomplete wellness questionnaires, missed readings, or just the absence of any data at all is a pattern. When a routine with an athlete breaks, it usually hints that things outside the training process are going to cause, or were already causing, problems.
Every big plunge I see in training data going south (read, poorly) is usually preceded or followed by an athlete getting data captured later or not at all. The goal of HRV is not just monitoring the athlete; it’s a good litmus test for determining if the person needs some TLC.
In the next article, I will go over interventions, training adjustments, and when sticking with your plan is sometimes the best option.
Since you’re here…
…we have a small favor to ask. More people are reading SimpliFaster than ever, and each week we bring you compelling content from coaches, sport scientists, and physiotherapists who are devoted to building better athletes. Please take a moment to share the articles on social media, engage the authors with questions and comments below, and link to articles when appropriate if you have a blog or participate on forums of related topics. — SF


I’ve been using Ithlete HRV for about the past six months, and are really getting better at understanding the correlations. As a senior athlete ( cyclist ) and a USA cycling coach – I think HRV monitoring and using it as a feedback tool is great in helping me understand myself, plan my workouts and build my power on the bike through daily feedback of stress and recovery.
Thanks to the simplifaster team for great content from real life coaches which I regularly share. I am only a 30+ guy who trains to get stronger. I run a blog at http://www.marathon-Crossfit.com and would also love some comments from experienced coaches on my reviews of lifting programs like stronglifts 5×5 and smolov in which I like to think that I am going the extra mile to make the content above the cut. That would help to make it even better.
Great read! Thank you!